Strong Growth in Transportation Spending by States
According to a new report by the National Association of State Budget Officers (NASBO), overall spending by states increased across the board in fiscal year 2019. Total state expenditures hit an estimated $2.1 trillion dollars for everything including education, corrections, environment, housing, and more.
It is notable here because the strongest growth rate last year came from transportation, even outpacing the growth in Medicaid. Transportation spending is now over eight percent of total state spending. While that may not seem like a lot, it represents about $172 billion in outlays; more than the entire economic output of Ghana, Panama, and Bulgaria combined.
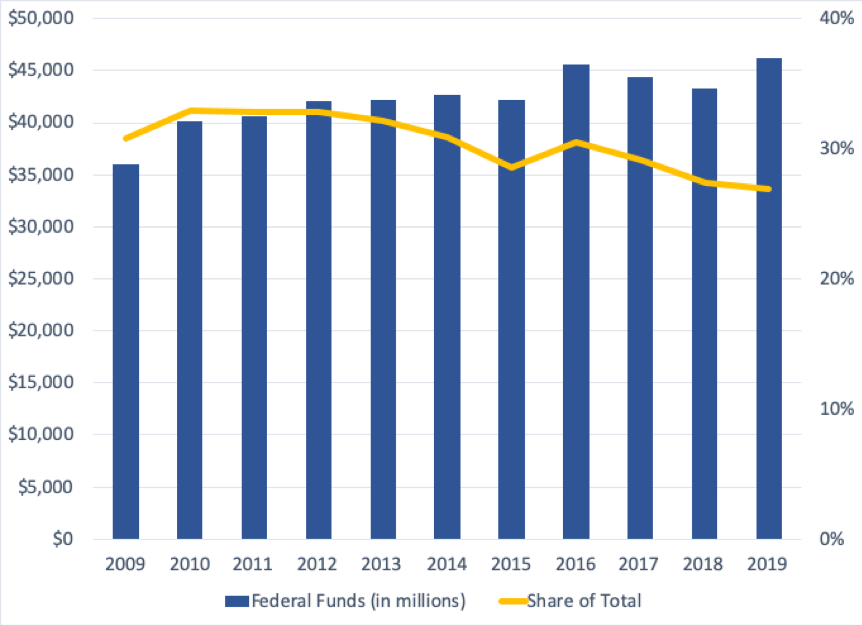
Federal funding made up an estimated 27 percent of total state transportation spending in fiscal year 2019, continuing its downward trend from a high of about 33 percent earlier in the decade (see figure.)
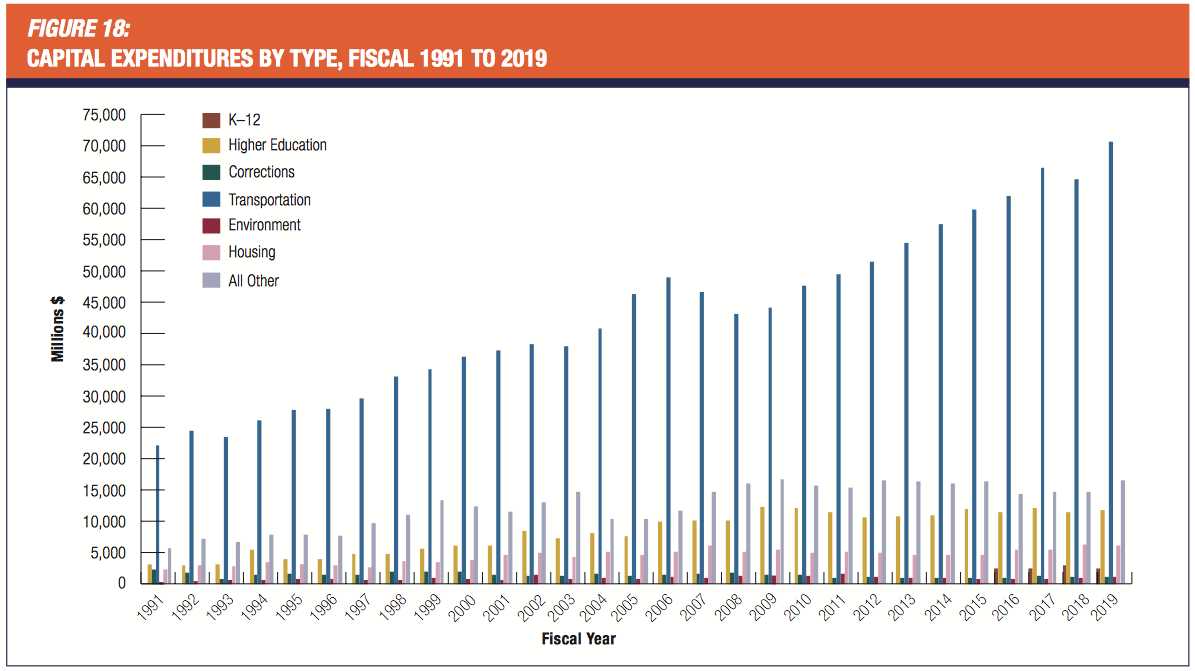
But that federal support is particularly important for capital expenditures for construction and other improvements. In fact, almost all the federal money that goes for capital purposes (94 percent) are for transportation. Transportation is also the largest category of state capital expenditures, by far.
Source: NASBO
Not surprisingly, the five largest states spend the most on transportation: California, Texas, Florida, New York, and Pennsylvania. But as a share of their total spending, the figures are different. Hawaii (14 percent), South Dakota (13 percent), North Carolina (13 percent), Idaho (13 percent), and Virginia (12 percent) saw the largest portions in 2019.
NASBO points out that the growth from fiscal year 2018-2019 did not just come from a few supercharged states. Fifteen saw increases in transportation spending greater than 10 percent. However, the median increase during that time was less than 3 percent. Several states saw very large increases from year to year like Idaho (75 percent), California (43 percent), and Rhode Island (40 percent.) But 16 states saw their share of transportation spending drop, led by five primarily rural states: Wyoming (-33 percent), West Virginia (-21 percent), Alabama (-27 percent), Iowa (-16 percent), and Arkansas (-15 percent.).
(State spending, year-to-year, in the aggregate tends to be a bit lumpy – 19 states use biennial budgeting, and two-year budgets tend to have a big spending increase in year one and a much smaller increase in year two. Most of the biennial states use an odd-even biennium (FY17-18, followed by FY19-20), but Kentucky, Virginia and Wyoming use an even-odd biennium (FY18-19, followed by FY20-21).)
While these figures are interesting for their detail and the ability to compare across places, there is an important caveat. NASBO is clear that states do not account for transportation spending the same way. Forty exclude at least a portion of state police and highway patrol spending, 39 omit ports, 23 exclude motor vehicle licensing, and more. Additionally, this report only tracks expenditures, not commitments or needs.
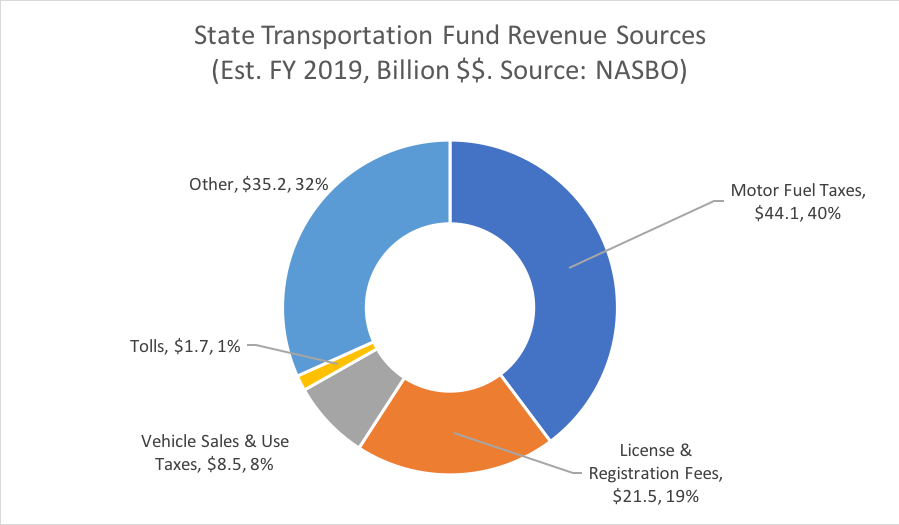
By far, the largest source of revenue for state spending for transportation is from “other state funds” (61 percent) which usually means the state equivalent of the federal Highway Trust Fund (called a Highway Fund in some states and a Transportation Fund in other states). The bulk of this money comes from motor fuels, but other charges on motorists are also deposited in many states, as is a growing amount of “other” revenues (sales taxes, petroleum industry taxes, and a wide variety of odds and ends).
When it comes to transportation capital spending, Table 52 in the NASBO report breaks down the state-by-state spending by revenue source. While there are some troubling omissions in the NASBO dataset (Missouri, Wisconsin, Colorado, Wyoming and South Carolina can’t really be spending zero dollars per year on transportation capital), the data they do have shows the variety of fiscal approaches chosen by different states.
In 2019, for example, Connecticut is estimated to support 71 percent of its transportation capital expenses through borrowing (bonding), and Massachusetts 67 percent. New Jersey and New York support 34 and 44 percent of their transportation capital spending by bonding, respectively. But outside the Northeast, bonding is used much more sparingly, with many states eschewing debt completely (Maryland, Tennessee, Indiana, Arkansas) or else using debt for well under 10 percent of total transportation capital.
Also, the NASBO dataset reports that New Jersey, Pennsylvania, and Georgia are the only states in 2019 that are using general revenues for transportation capital.
![]()
Again, the full report can be downloaded here.
(See also this companion piece from Eno’s Jeff Davis putting the 2019 spending data in perspective with inflation-adjusted historical spending.)

