As part of the National Association of State Budget Officers’ recently updated report on state spending levels, they reported that total state spending for capital expenses relating to transportation had climbed to an estimated $73 billion in fiscal year 2019, a 9 percent increase above fiscal 2018. Elsewhere in this issue, Eno’s Robert Puentes has a breakdown of more of the 2019 state spending data.
But this also means that NASBO has updated its master dataset that dates back to fiscal year 1991, which lets us look at longer-term trends. Specifically, transportation capital spending. In nominal terms, here are the NASBO reports on transportation capital expenses by state governments, by funding source, from 1991-2019:
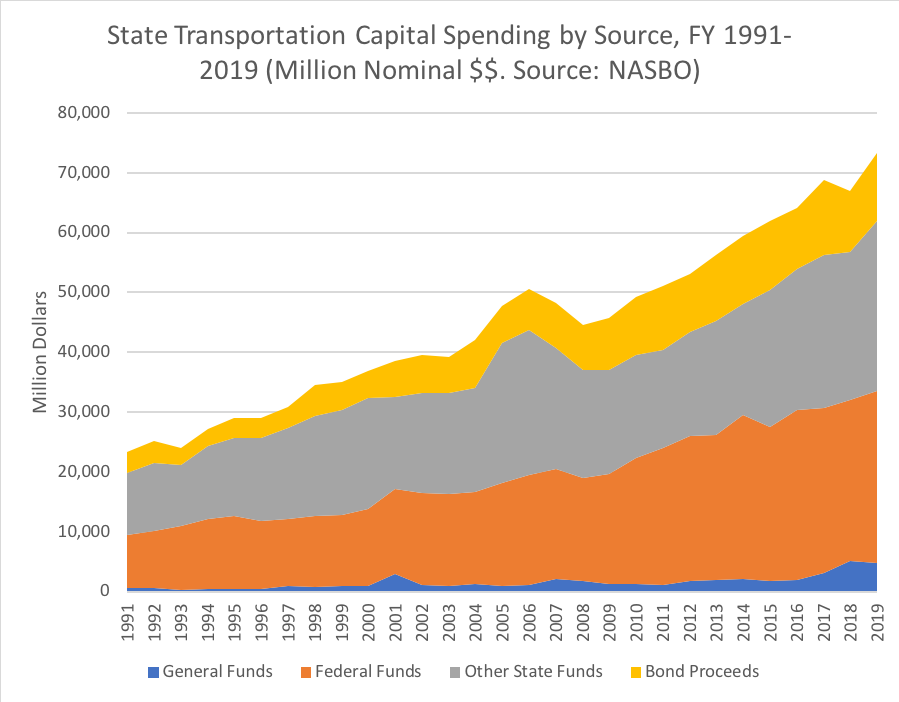
After a lull from 2017 to 2018, there was that sharp pickup in 2019 (states that use biennial budgets cause some lumpy spending increase data).
But the farther back in history you look, the less useful nominal dollars are. How to account for inflation – not consumer-perceived inflation in the costs of food, household rent, utility bills, education, etc., but for inflation in the cost of building transportation capital projects?
We looked to the wonderful Congressional Budget Office report on public transportation and water infrastructure spending from 1956-2017 and decided to just use the same inflation factors they used – Bureau of Economic Analysis price indices specifically for state fixed investment on highways and streets (NIPA Table 5.9.4, line 40, if you are interested). We used the FY 1991-2017 deflators incorporated in the CBO numbers and then used the NIPA update for 2018 (a 4.8 percent increase over 2017) and then just rounded to a 4.0 percent guesstimate for 2019.
There are some holes in this method, particularly CY to FY conversion for 2018, missing data for 2019 and the fact that states usually use a fiscal year starting July 1 instead of the federal October 1, but the trend lines should be accurate enough.
When you account for inflation, the same underlying data reported above looks very, very different:
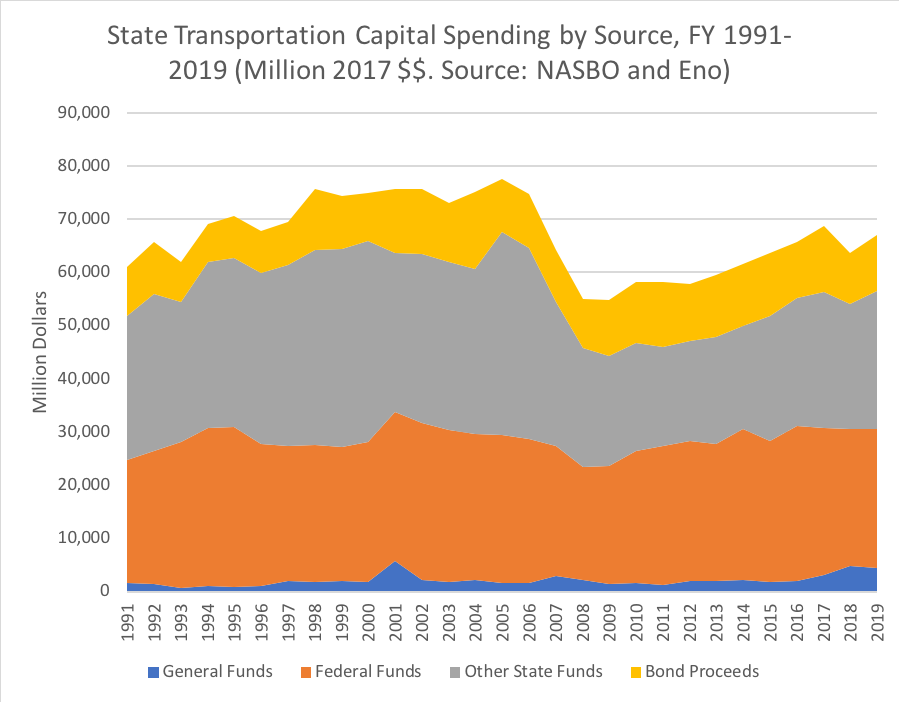
Using this inflation-adjusted measure, total state spending on transportation capital peaked in FY 2005, at $78 billion, and then fell of a cliff, bottoming out at $55 billion in FY 2009 before slowly recuperating.
Interestingly, the federal share of state funding has remained fairly constant, in inflation-adjusted dollars, by this measure, it peaked in 1995 at $30 billion and then almost hit $30 billion again in 2002. It dropped as low as $21 billion in 2008 but then rose again as high as $27.5 billion in 2017.
But the spending from “other state funds” (principally the state transportation trust funds), dropped from an inflation-adjusted $38.0 billion in FY 2005 down to $18.7 billion in FY 2011 (cut in half!) and has only climbed back to about $26-ish billion in 2019 in those constant 2017 dollars (about two-thirds of the 2005 peak level).
Again: the NASBO dataset is incomplete, and there can be inflation methodology quibbles. But the overall trend in the NASBO data, adjusted for inflation in this manner, does follow the trend in that aforementioned CBO report. (That CBO report also broke things down by mode – when you take out federal assistance, CBO says that state and local highway capital spending peaked in 2005 at $67.3 billion and, since then, has only gone as high as $54.7 billion (FY 2015) – 81 percent of peak. But mass transit capital spending by state and local governments also peaked in 2004, at $17.3 billion, and has since made it back as high as $16.0 billion (also FY 2015) – 92 percent of peak.)
Here are the transportation capital numbers from the NASBO report, 1991-2019, using the CBO inflation adjuster for 1991-2017 (with a 3-month lag between CBO’s reporting of federal fiscal years and the average state fiscal years), and with rough guesswork for comparable 2018 and 2019 inflation, in billions of dollars, by funding source:
Inflation-Adjusted State Capital Spending on Transportation, 1991-2019
|
| Billions of 2017 dollars by state fiscal year. (2018-9 inflation adjustments are very approximate.) |
|
1991 |
1992 |
1993 |
1994 |
1995 |
1996 |
1997 |
1998 |
1999 |
2000 |
| State General Funds |
1.5 |
1.4 |
0.8 |
1.0 |
1.0 |
1.1 |
2.0 |
1.7 |
2.0 |
1.8 |
| Federal Funds |
23.1 |
25.0 |
27.4 |
29.8 |
30.0 |
26.6 |
25.4 |
25.9 |
25.2 |
26.2 |
| State Other Funds |
27.2 |
29.6 |
26.4 |
31.2 |
31.8 |
32.2 |
34.0 |
36.6 |
37.2 |
37.9 |
| State Bonding |
9.2 |
9.6 |
7.5 |
7.1 |
7.9 |
7.9 |
8.2 |
11.4 |
10.1 |
9.1 |
| Total |
61.1 |
65.6 |
62.0 |
69.1 |
70.6 |
67.8 |
69.6 |
75.6 |
74.4 |
75.0 |
|
|
|
|
|
|
|
|
|
|
|
|
2001 |
2002 |
2003 |
2004 |
2005 |
2006 |
2007 |
2008 |
2009 |
2010 |
| State General Funds |
5.8 |
2.2 |
1.9 |
2.3 |
1.6 |
1.7 |
2.9 |
2.2 |
1.5 |
1.6 |
| Federal Funds |
28.0 |
29.4 |
28.6 |
27.3 |
27.9 |
27.0 |
24.4 |
21.3 |
22.1 |
24.7 |
| State Other Funds |
30.0 |
31.8 |
31.5 |
31.1 |
38.0 |
35.9 |
27.1 |
22.4 |
20.8 |
20.4 |
| State Bonding |
11.9 |
12.2 |
11.1 |
14.5 |
10.1 |
10.2 |
9.9 |
9.2 |
10.4 |
11.4 |
| Total |
75.6 |
75.6 |
73.1 |
75.1 |
77.6 |
74.8 |
64.3 |
55.0 |
54.8 |
58.2 |
|
|
|
|
|
|
|
|
|
|
|
|
2011 |
2012 |
2013 |
2014 |
2015 |
2016 |
2017 |
2018 |
2019 |
|
| State General Funds |
1.3 |
1.9 |
2.0 |
2.2 |
1.8 |
1.9 |
3.2 |
4.9 |
4.4 |
|
| Federal Funds |
26.0 |
26.4 |
25.7 |
28.4 |
26.6 |
29.1 |
27.5 |
25.7 |
26.3 |
|
| State Other Funds |
18.7 |
18.8 |
20.2 |
19.3 |
23.5 |
24.2 |
25.6 |
23.5 |
25.9 |
|
| State Bonding |
12.2 |
10.6 |
11.6 |
11.8 |
11.9 |
10.4 |
12.5 |
9.7 |
10.4 |
|
| Total |
58.2 |
57.8 |
59.5 |
61.6 |
63.7 |
65.6 |
68.8 |
63.7 |
67.0 |
|

