According to the U.S. Department of Transportation (U.S. DOT), about 80 percent of domestic airline flights arrive on-time every year. That figure is largely unchanged since 2003 (Figure 1). However, those flights that are delayed often cause considerable frustration for passengers and come with a $32 billion hit on the American economy each year.[1]
Figure 1: Percentage of Delayed Flights
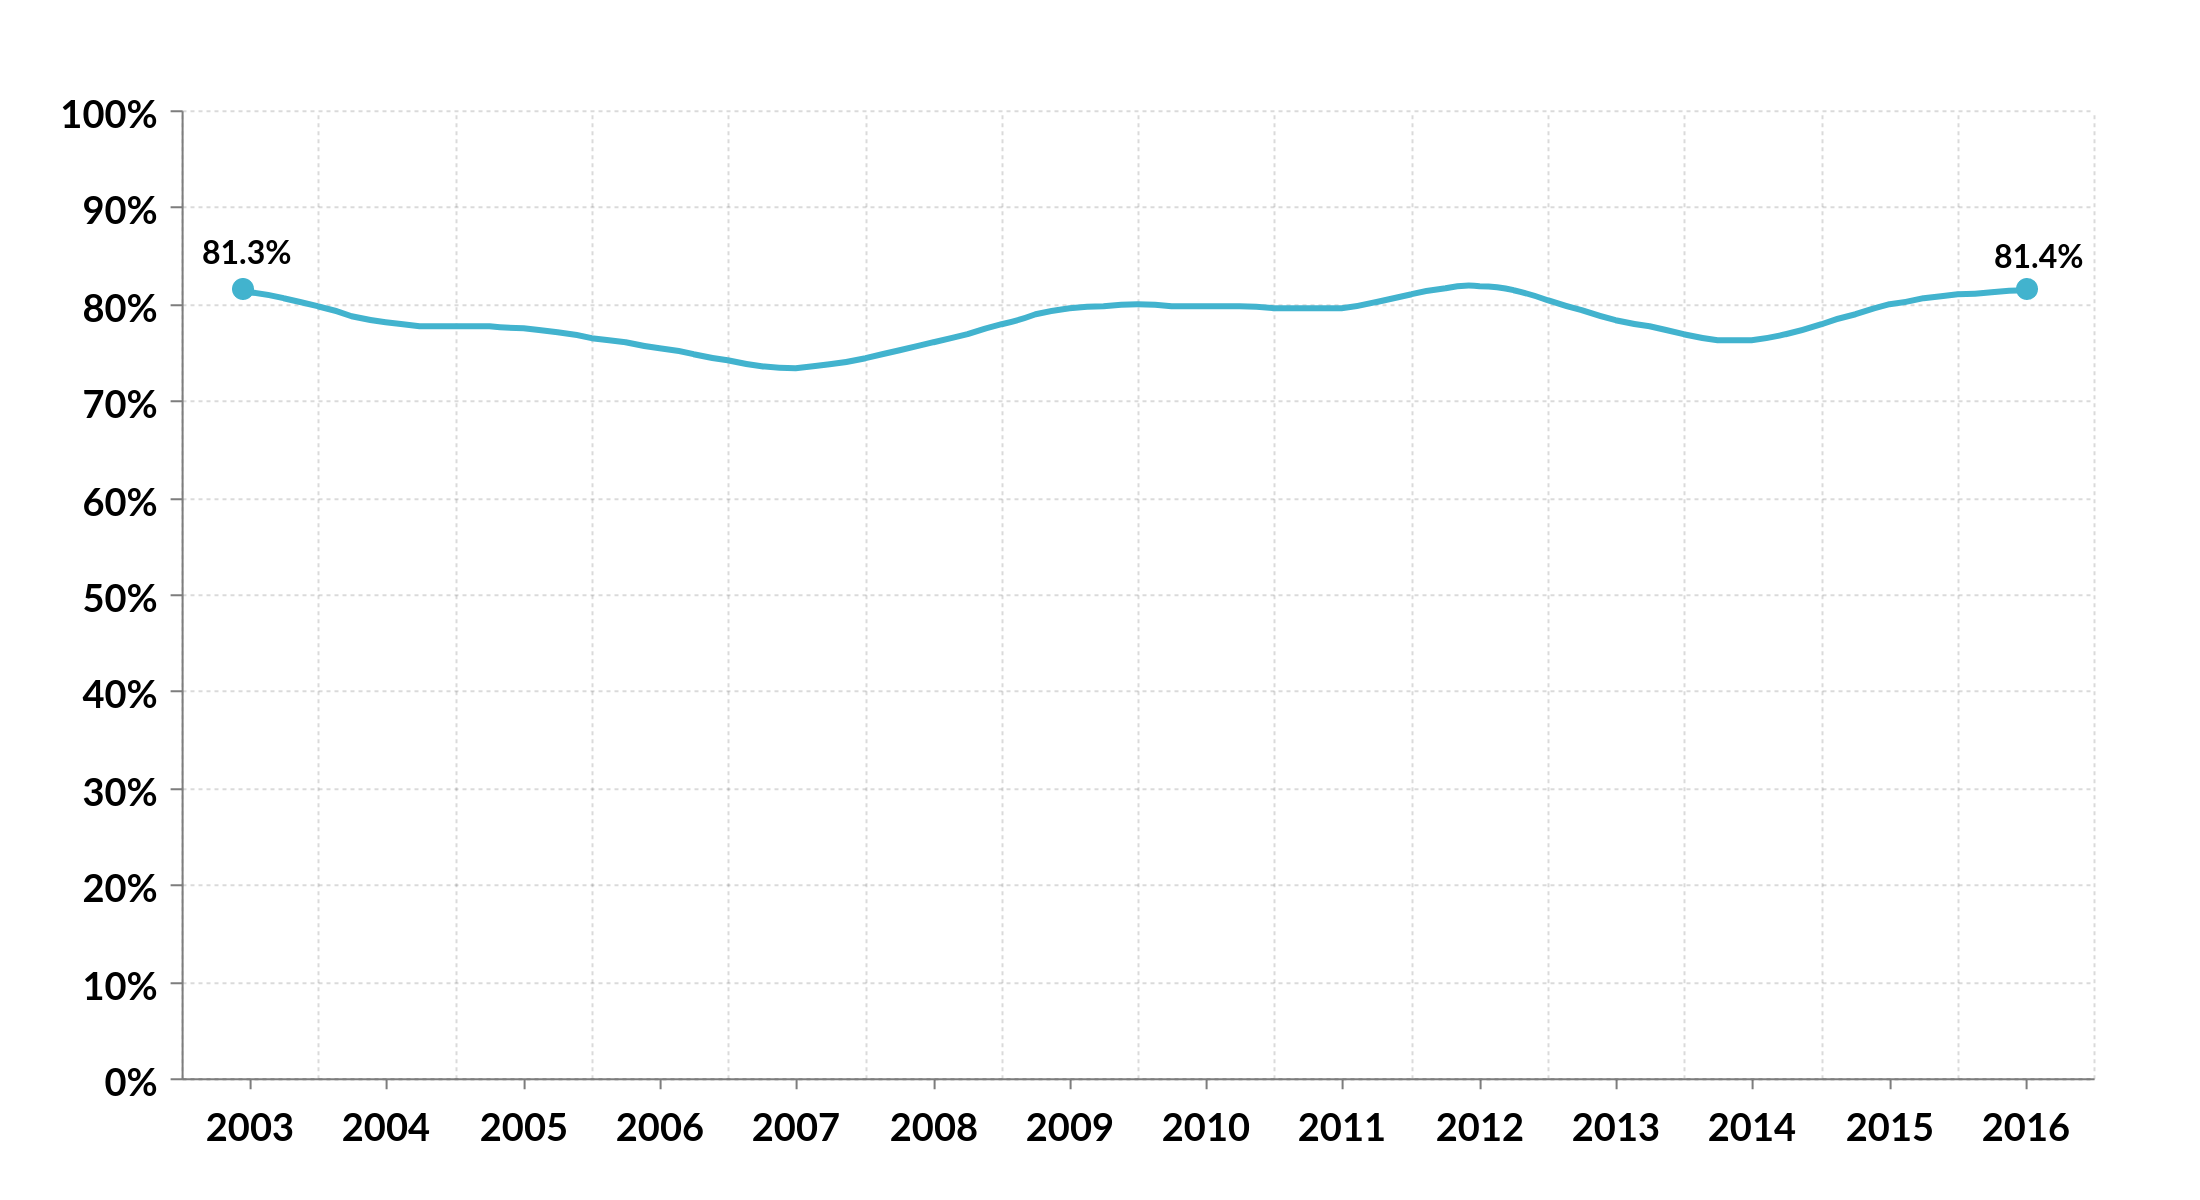
Source: Bureau of Transportation Statistics, “On-Time Performance – Flight Delays at a Glance.”
Flyers hate being delayed and when they are, they want to know why. Data and information about flight delays is not only useful in understanding who or what is responsible for travel headaches, but can also help determine how to target taxpayer dollars to address problems. For example, investing in new runway capacity, gates at airports, or NextGen air traffic control is expensive, but can improve overall delays if done effectively.
The federal government directs air carriers to report on-time performance data every month for all their flights.[2] The data requirements include dozens of different fields including basic flight and airport information. Airlines are also required to submit information about the time flights landed and departed, how long they spend at the gate, and whether there were delays or cancellations and the reasons. An aircraft is considered delayed if it arrived or departed 15 or more minutes after the schedule.[3]
This data is self-reported by the airlines and shows that delays attributed to them are going up, while delays attributed to the capacity and efficiency of the system are going down.[4] However, Eno found that the data the federal government collects provides an insufficient and opaque understanding of airline delays and cancellations.
As currently reported, the information about reasons for delays and cancellations remain grouped into several categories. While the U.S. DOT provides examples for these categories that would be helpful for analysis, they are only reported at the aggregate level (Table 1). These broad reports make it difficult for the data collected on delays to meet its primary purpose of identifying problems in order for the appropriate parties to take corrective action.
Table 1: Examples of causes for delays and cancellations by category
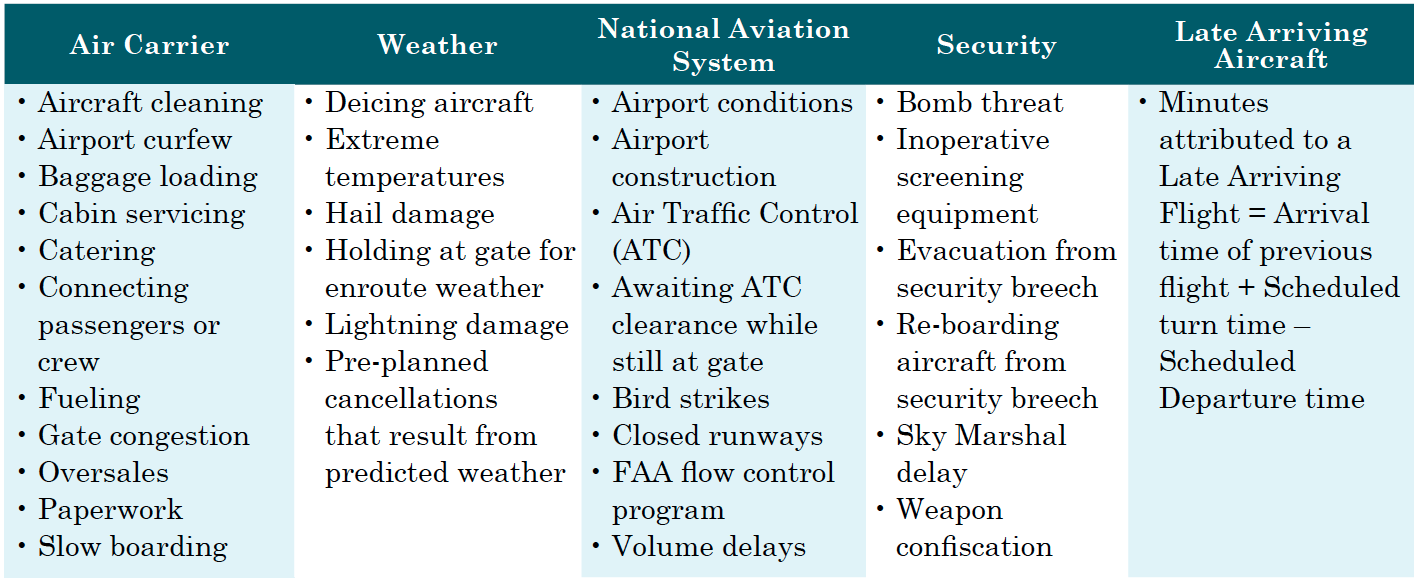
Source: U.S. DOT Technical Reporting Directive #27 – On-Time Performance.
The delay data also does not account for airlines adding more time to their schedules—a practice known as schedule “padding”—to take into account the system’s inefficiencies.[5] For example, in 1996 about 80 percent of the flights from New York’s LaGuardia airport to Chicago’s O’Hare were allotted a block of time of about 2 hours and 30 minutes or less. By 2015, almost no airlines expected the flight to be that short with the vast majority putting it 15 to 20 minutes longer. Similarly, while every flight from San Francisco to Los Angeles International was slotted at under 1 hour and 30 minutes in 1996, only about two-thirds are that short today.[6] Across the system, the average aircraft arrived eight minutes early in January 2017, up from three minutes early in 1998, also indicating schedule padding.[7] This practice makes it difficult to understand the trends in delays. A plane can arrive at an airport with some type of delay and still be considered on-time thanks to extra time allotted by schedule padding.
Fortunately, a new directive from the U.S. DOT expands the list of air carriers that are required to report flight data from the 12 largest to the 18 largest.[8] It also increased the list of airports about which data must be submitted from just the 30 largest to include any large, medium, small, or non-hub airport.[9] While these new requirements may place an additional burden on the airlines, the U.S. Government Accountability Office recently found that “without this information, DOT cannot fully achieve the purpose of providing consumers with information on airlines’ quality of service.”[10]
International examples may provide good models to improve data availability and transparency. The pan-European agency EUROCONTROL publishes an annual report that includes measures of efficiency of that continent’s air traffic control (ATC) system.[11] EUROCONTROL reports on how many minutes ATC delayed each flight, both in the air (0.9 minutes per flight in 2016) and on the ground (2.4 minutes). They also reported that in 2016 flights, on average, flew routes that are 2.8 percent longer than the optimal routes, i.e., a 1,000-mile flight actually flew 1,028 miles. That data, if further disaggregated into categories such as capacity, staffing, strikes, and special events such as outages could be used for further analysis. Besides delays, EUROCONTROL makes a plethora of data on the European ATC system available on a dedicated website.[12]
What do we know about aircraft delays?
Answers:
• The percent of reported on-time domestic flights has remained relatively constant since 2003, but during that same time airlines have increased the schedule times for their flights. With scheduling and reporting data lacking transparency and granularity, it is not possible to answer who or what is responsible for most delays with sufficient precision.
• Better data is needed to assess both the efficiency of flights and the effectiveness of public investments in the national airspace system. While there is plenty of data available in the United States on airports and airlines, there is no comparable data published on how the system operates, how public dollars can improve problems with airport capacity, and on the ATC system.
Eno Aviation Insights homepage
Question 6: Where are airline passengers getting the best service?
[1] Michael Ball and others, “Total Delay Impact Study: A Comprehensive Assessment of the Costs and Impacts of Flight Delay in the United States,” National Center of Excellence for Aviation Operations Research, 2010.
[2] U.S. Department of Transportation, Bureau of Transportation Statistics, Office of Airline Information, 14 C.F.R. § 234; Technical Reporting Directive #27 – On-Time Performance, August 15, 2017.
[3] U.S. Department of Transportation, Bureau of Transportation Statistics, Airports, 2017.
[4] These percentages are estimated based on the number of delayed flights. I.e., for 2016, out of 100 delayed flights, 49 were caused by the national aviation system, 46 by the airlines, and 5 by weather. See: Bureau of Transportation Statistics, “Aircraft Arriving Late: Causes of the Original Delay”, U.S. Department of Transportation, 2017.
[5] The Economist, “In Defense of Schedule-Padding,” February 23, 2013.
[6] OAG Aviation Worldwide Limited, “Great Expectations Lifting the Lid on Airline On-Time Performance,” 2015.
[7] U.S. Department of Transportation, Bureau of Transportation Statistics, Database: Airline On-Time Performance Data, January 1998, January 2017.
[8] The new federal directive dropped the reporting threshold from airlines with one percent of Industry Scheduled-Service Domestic Passenger Revenues to airlines with one-half of one percent. The list now includes regional carriers such as Allegiant, Endeavor, Envoy, Mesa, PSA, and Republic.
[9] Susan Stellin, “Those On-Time Flight Numbers? They’re Expected to Decline Next Year.” New York Times, September 18, 2017.
[10] U.S. Government Accountability Office, “Airline Passenger Protections: More Data and Analysis Needed to Understand Effects of Flight Delays,” GAO-11-733, 2011.
[11] Performance Review Commission, “PRR 2016 – Performance Review Report, An Assessment of Air Traffic Management in Europe during the Calendar Year 2016”, EUROCONTROL, 2017.
[12] Performance Review Unit, “European ANS Performance Data Portal”, EUROCONTROL, 2017.
Eno wishes to acknowledge its Aviation Working Group, a standing advisory body that provides Eno staff with guidance and expertise on all matters related to aviation policy. The opinions expressed are those of Eno and do not necessarily reflect the views of our supporters.