Throughout the United States, the average passenger is paying less to fly and is taking more direct flights than 15 years ago.[1] These broad trends are certainly positive for flyers as a whole. However passengers in specific regions often have a much different experience. While traffic is up and fares are down in large metropolitan areas where service is now concentrated, the experience in other places varies quite a bit.
Some regions that were once key centers for major airlines have recently been “de-hubbed,” leading to significant cutbacks. Memphis and Cincinnati, former hubs of Northwest Airlines, saw daily flights fall from 240 to 100 and 600 to less than 100, respectively.[2] Cleveland saw United remove nearly 50 non-stop destinations after its merger with Continental.[3] Yet not all medium hub airports have lost out. Some have seen other carriers come in and partially take over the services they once had.[4]
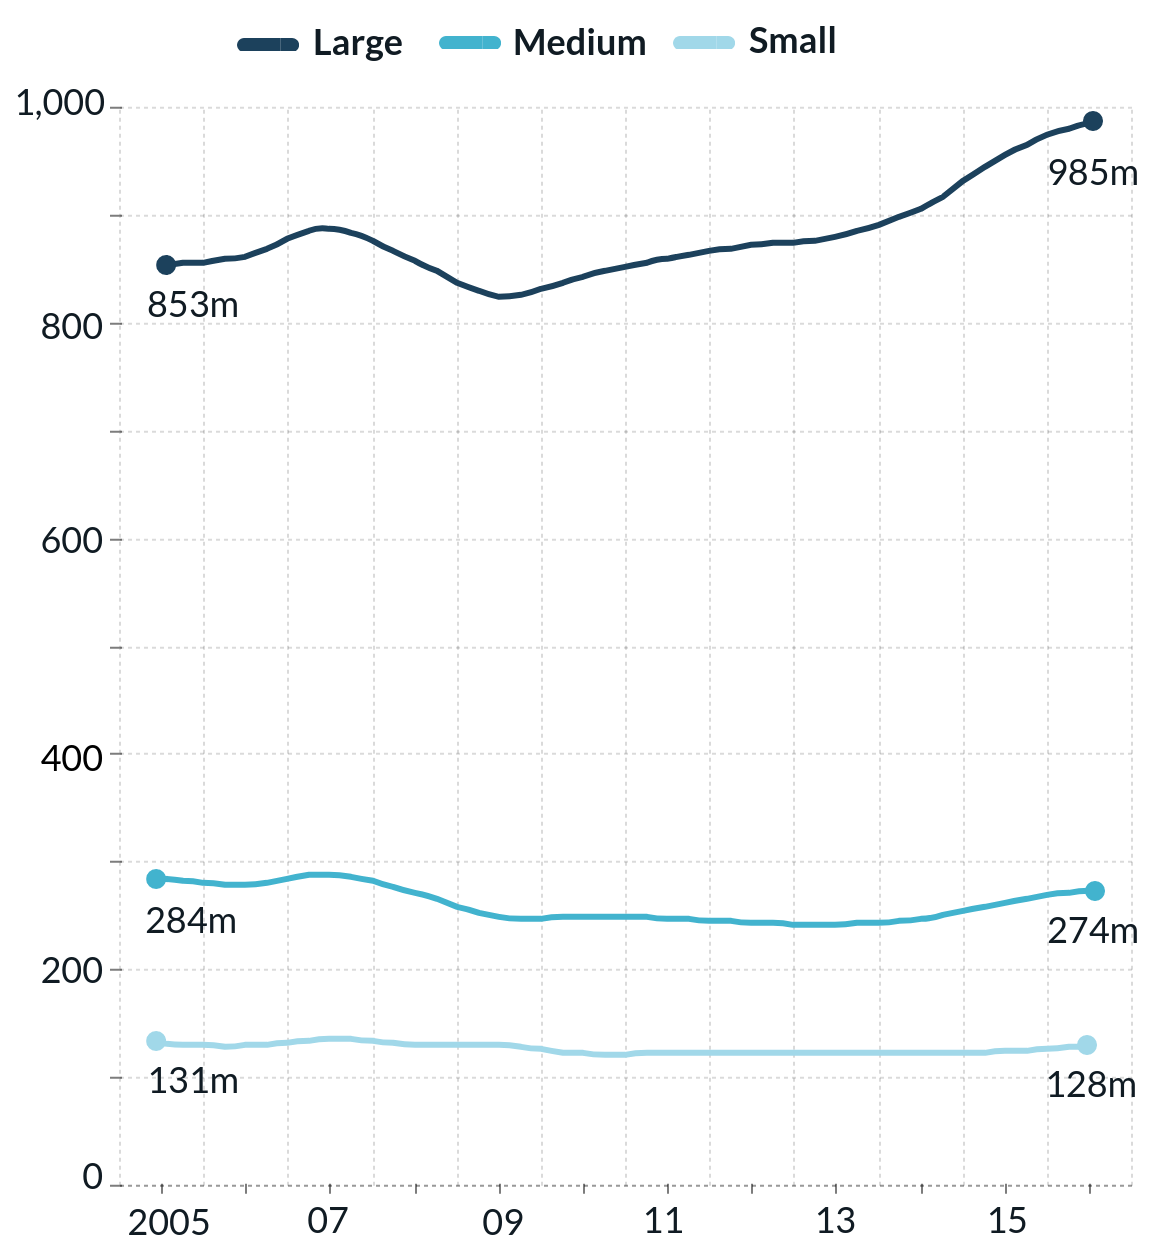
Figure 1 shows that while passenger totals at large hub airports have increased over the past decade, on average, passenger counts at small and medium size hubs have remained relatively the same.[5]
Hub Airport Defined:
A hub airport is associated with an airline that established an operational focus there, such as Delta in Atlanta or American in Dallas. From a statistical standpoint, the Federal Aviation Administration (FAA) defines a hub as any airport that carries more than 0.05 percent of all passengers in a given year. Small hubs carry between 0.05 and 0.25 percent of passengers (less than around five million passengers per year), medium hubs carry between 0.25 and 1 percent (around between five million and 15 million passengers per year), and large hubs more than 1 percent of all passengers (around 15 million or more passengers per year).[6]
Figure 1. Total number of domestic passengers (millions)
Source: Bureau of Transportation Statistics, “Airport Snapshot,” U.S. Department of Transportation, 2017.
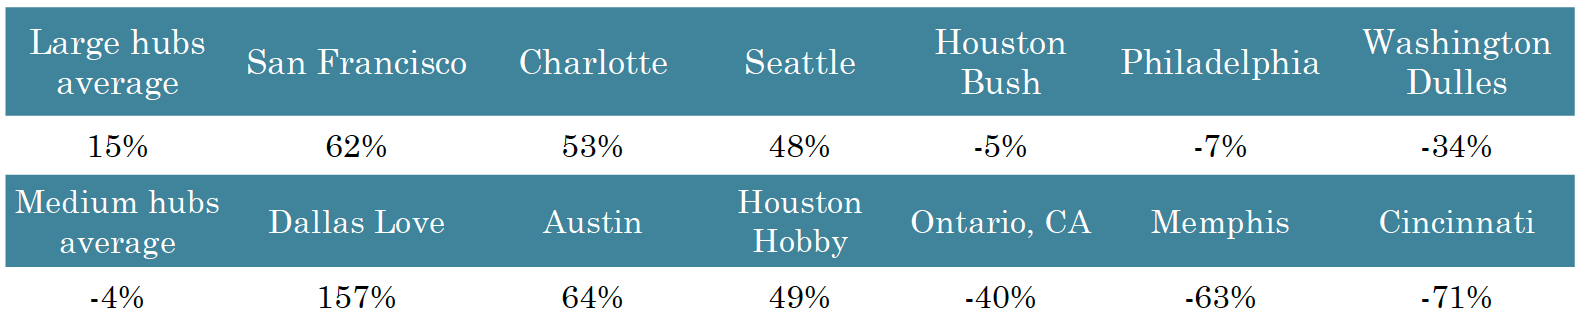
However, a few airports contribute disproportionally to the decline or growth of the number of passengers carried. Table 1 shows the airports that have the greatest increase or decline in traffic since 2005.[7] Removing Ontario, Memphis and Cincinnati from the mix, medium hubs would have seen a growth of six percent (14 million passengers) over this period, buoyed from Southwest hubs in fast-growing Texas. The decline in passengers at Ontario, Memphis, and Cincinnati is due to specific aspects of these three geographic markets, explored below.
Table 1. Total change in passengers at fastest growing and declining medium and large hubs (2005-2016)
Source: Bureau of Transportation Statistics, “Airport Snapshot”, U.S. Department of Transportation, 2017.
As an earlier Eno Aviation Insights brief shows, the cost of an average airline ticket is near all-time lows. And medium hubs have long been on average less expensive for fliers than domestic flights at larger hubs.[8] However, Figure 2 shows that the gap between ticket prices at large and medium hubs has narrowed. Passengers at the largest hubs, which carry 71 percent of travellers, saw a 3 percent drop in ticket price since 2005 (after the five major airline mergers). But fares at medium hubs rose by 5 percent over this same period.
Figure 2. Average one-way domestic fares at large and mediums hubs
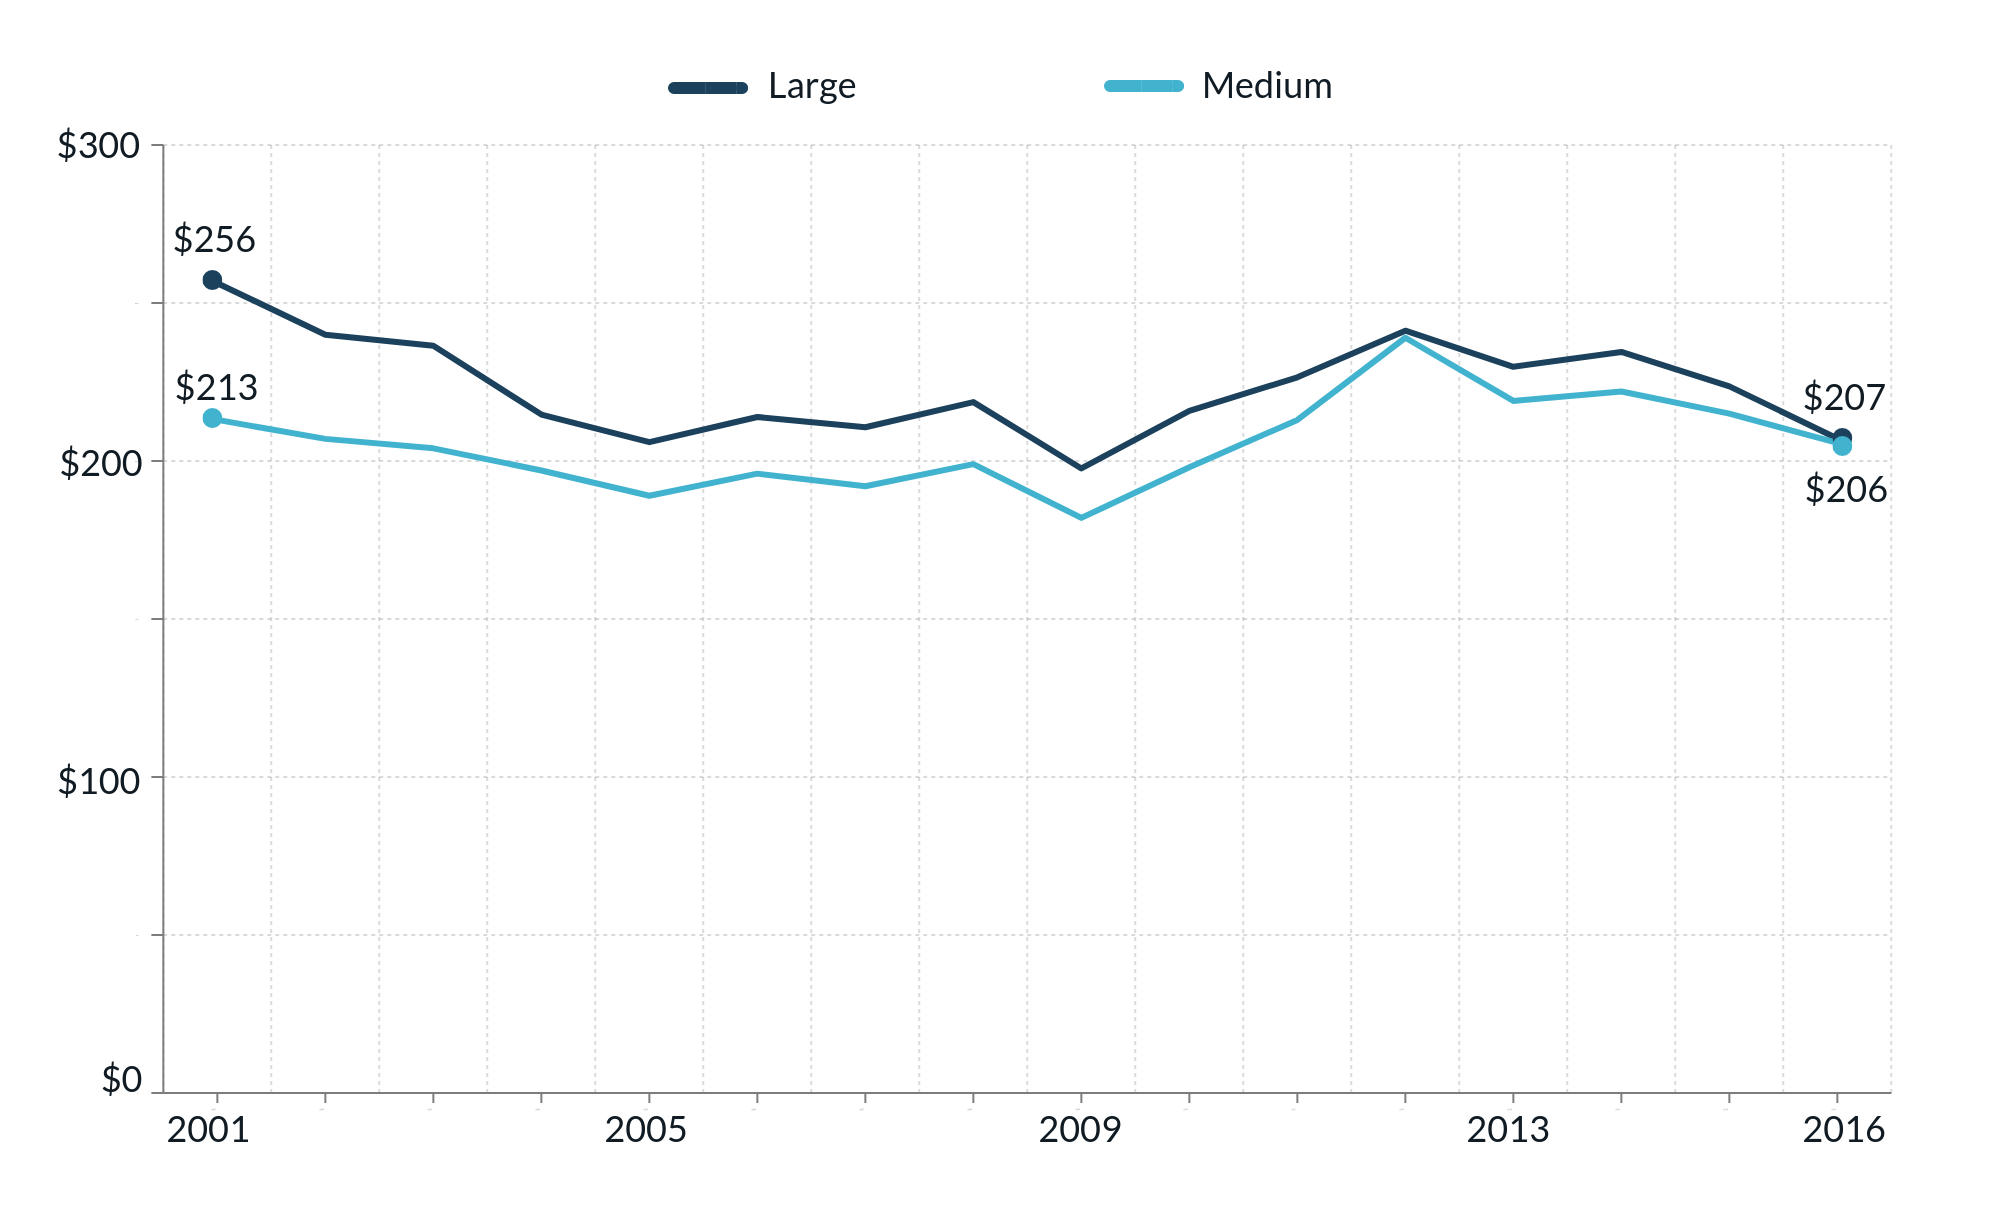
Source: Office of Aviation Analysis, “Domestic Airline Consumer Airfare Report”, U.S. Department of Transportation, 2017. Figures in constant dollars.
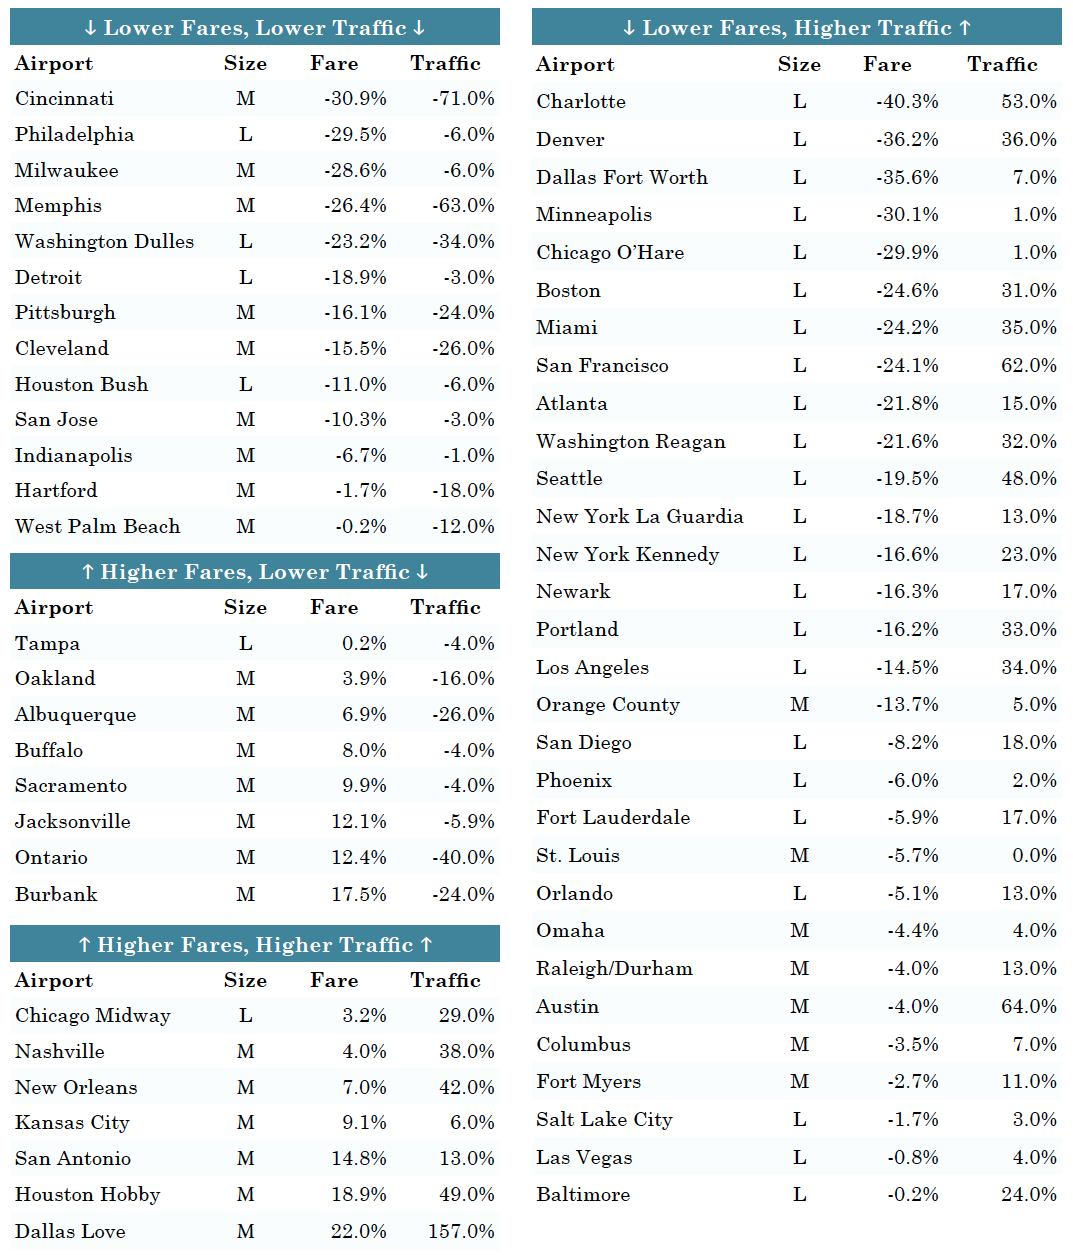
Table 2 shows the changes in fares and passenger traffic for all medium and large hubs. Almost all of the large hubs have seen both lower fares and higher traffic since 2001. Medium hubs mostly saw declines in traffic and/or increases in ticket prices. Seven airports saw increases in ticket prices above 10 percent over fifteen years (Burbank, Dallas Love Field, Houston Hobby, Jacksonville, Ontario, Sacramento, and San Antonio). Another six airports saw both increases in ticket prices and decreases in domestic traffic: Albuquerque, Buffalo, Burbank, Jacksonville, Oakland, and Ontario.
Table 2. Change in one-way domestic fares and passenger traffic at large and mediums hubs, 2001-2016
Source: Office of Aviation Analysis, “Domestic Airline Consumer Airfare Report”, U.S. Department of Transportation, 2017 and Bureau of Transportation Statistics, “Airport Snapshot”, U.S. Department of Transportation, 2017.
Competition between airlines at an airport can enable more destination and price options as well as better customer service, and airline consolidation could potentially increase the shares of dominant carriers.[9] But Figure 4 shows that despite mergers, the average share of traffic by the top two airlines at each medium and large hub grew only slightly over the past ten years (in terms of domestic passengers carried).
Figure 4. Share of passenger traffic for the first and second largest carriers at large and medium hubs
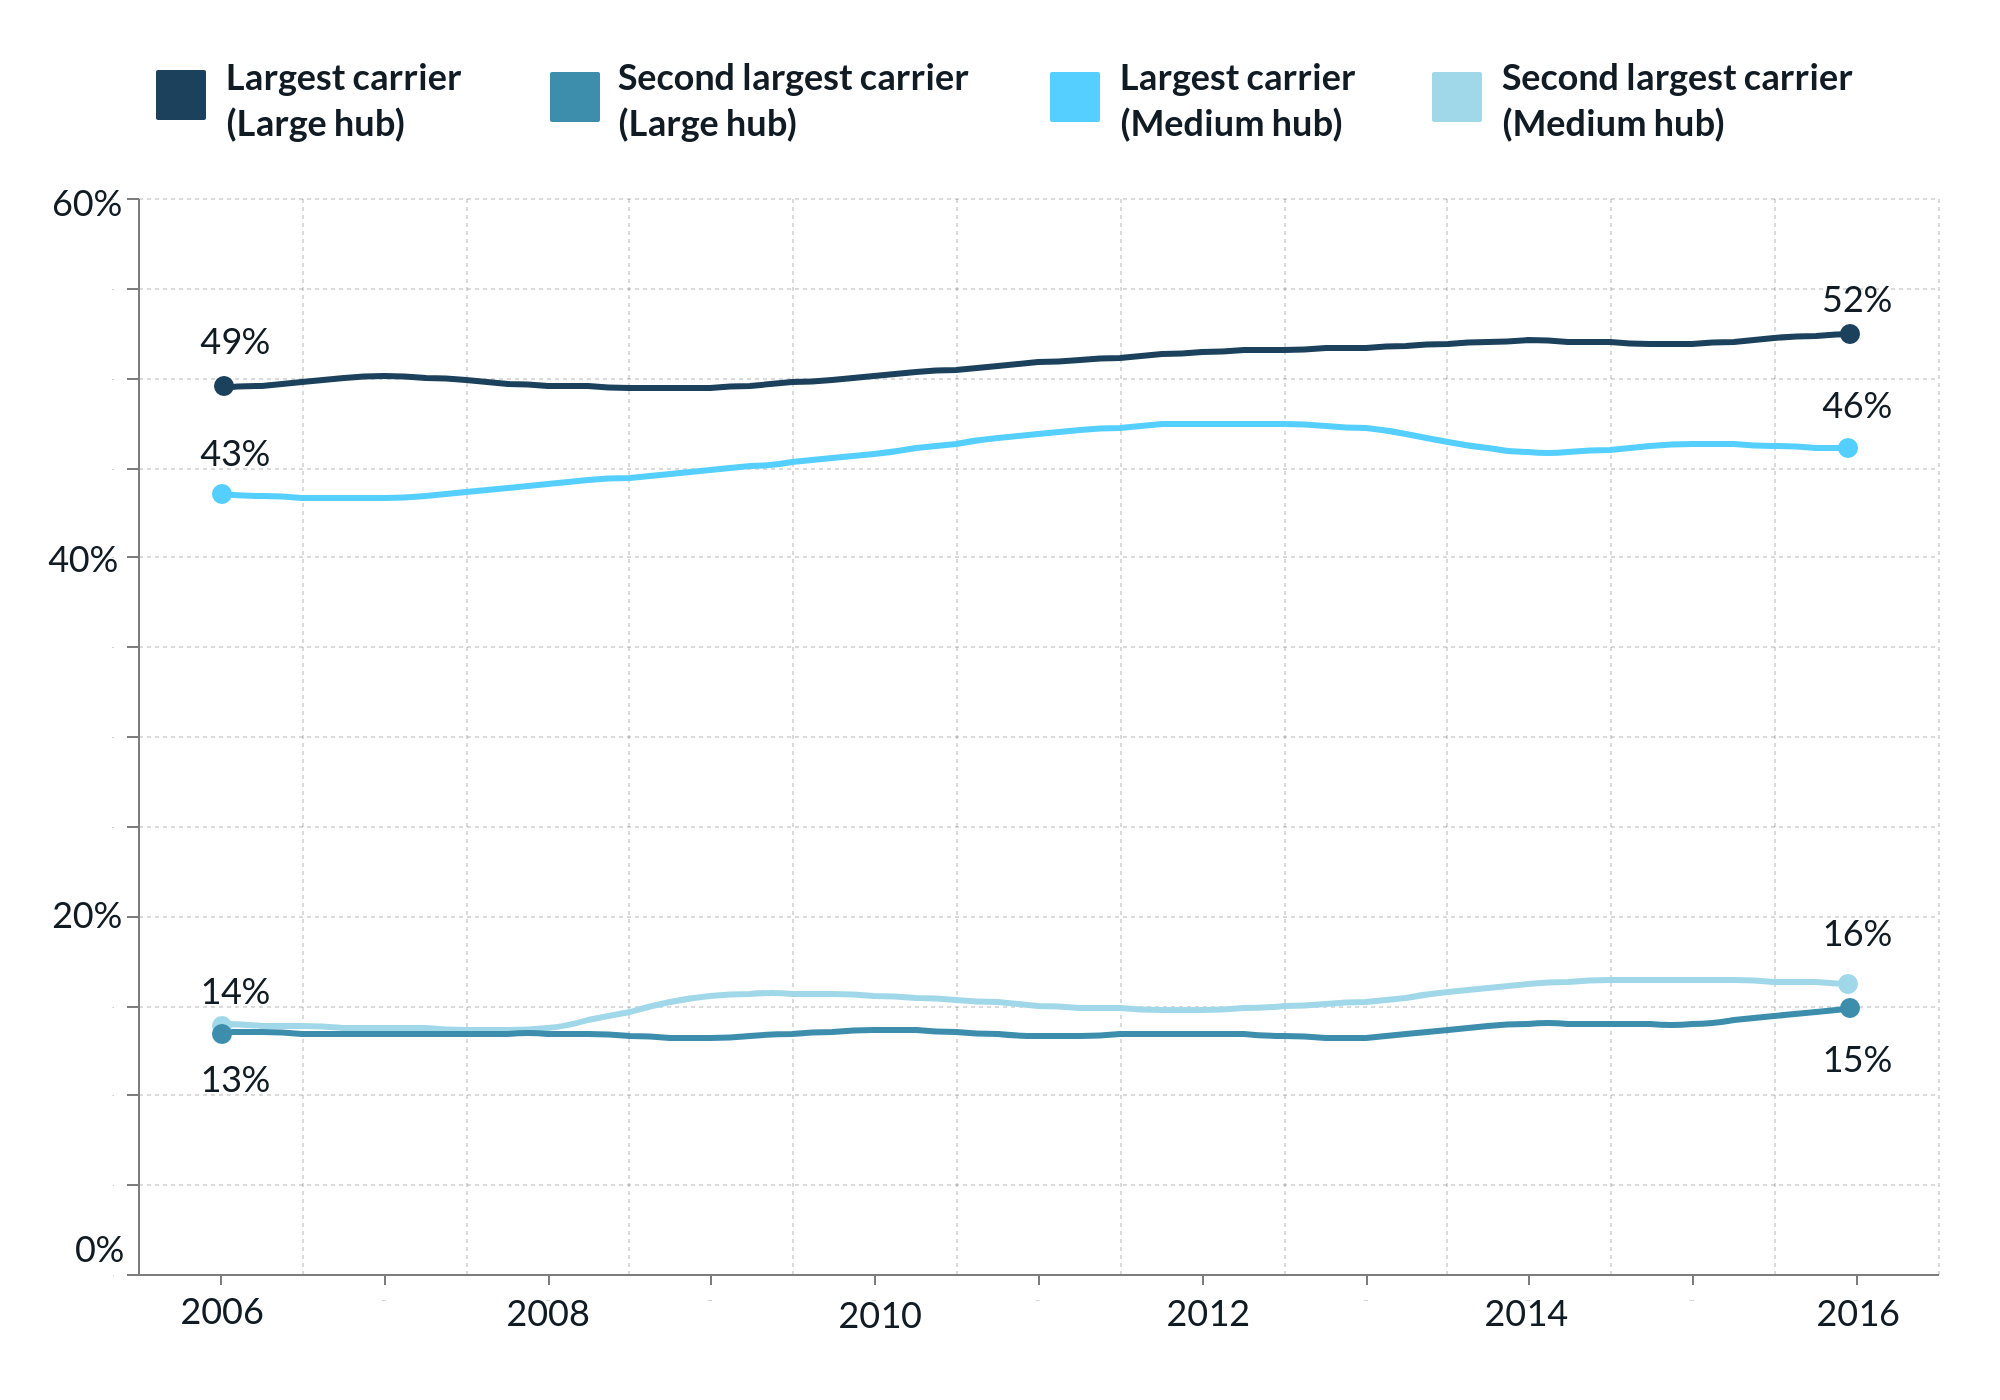
Source: Bureau of Transportation Statistics, “Airport Snapshot”, U.S. Department of Transportation, 2017.
Looking at specific locations, Figures 5 and 6 show more nuances in individual airports with respect to the share of passenger traffic of the largest airlines.[10] The six airports with the greatest domestic traffic growth in the 2006-2016 period (Figure 5) fall into one of two categories. In the case of Dallas Love and Houston Hobby, the growth is entirely from the dominant airline (Southwest in both cases). For Austin, San Francisco, Seattle, and Charlotte, all had several airlines with a significant presence and all of the airlines have expanded their presence.
The six airports with the greatest domestic traffic decline in the 2006-2016 period (Figure 6) fall into one of three categories. The first includes places like Memphis, Cincinnati, and Cleveland that lost their hub status as airlines merged and passenger levels shrank. The second refers to airports that saw significant competition from other nearby airports. For instance, Washington Reagan and Los Angeles both grew substantially, taking traffic from Washington Dulles and Ontario, respectively. Only one airport is in the third category–Albuquerque–where passenger volumes decreased in large part due to the repeal of the Wright Amendment. That obscure federal law had prohibited flights to and from Dallas Love Airport beyond Texas and its neighboring states. Therefore, Southwest had been using Albuquerque as a stopover between Dallas and popular west coast destinations. Once the law was repealed in 2014, the airlines cut flights.[11]
Where medium hubs have grown, data shows that it is often from an increase in Southwest traffic. The company’s business model often targets medium-sized airports, which has helped it to become the largest carrier at Buffalo, Burbank, Columbus, Fort Myers, Indianapolis, Kansas City, New Orleans, Oakland, Omaha, Ontario, Pittsburgh, Saint Louis, San Jose, and Orange County. Southwest is now the largest carrier in all but nine of the 32 medium hubs (Table 3). Three of the medium hubs where Southwest is not the largest carrier are not in the continental United States (Anchorage, Kahului, and San Juan).
Figure 5. GROWTH: Share of passenger traffic for the first and second largest carriers at the six airports that had most passenger growth*
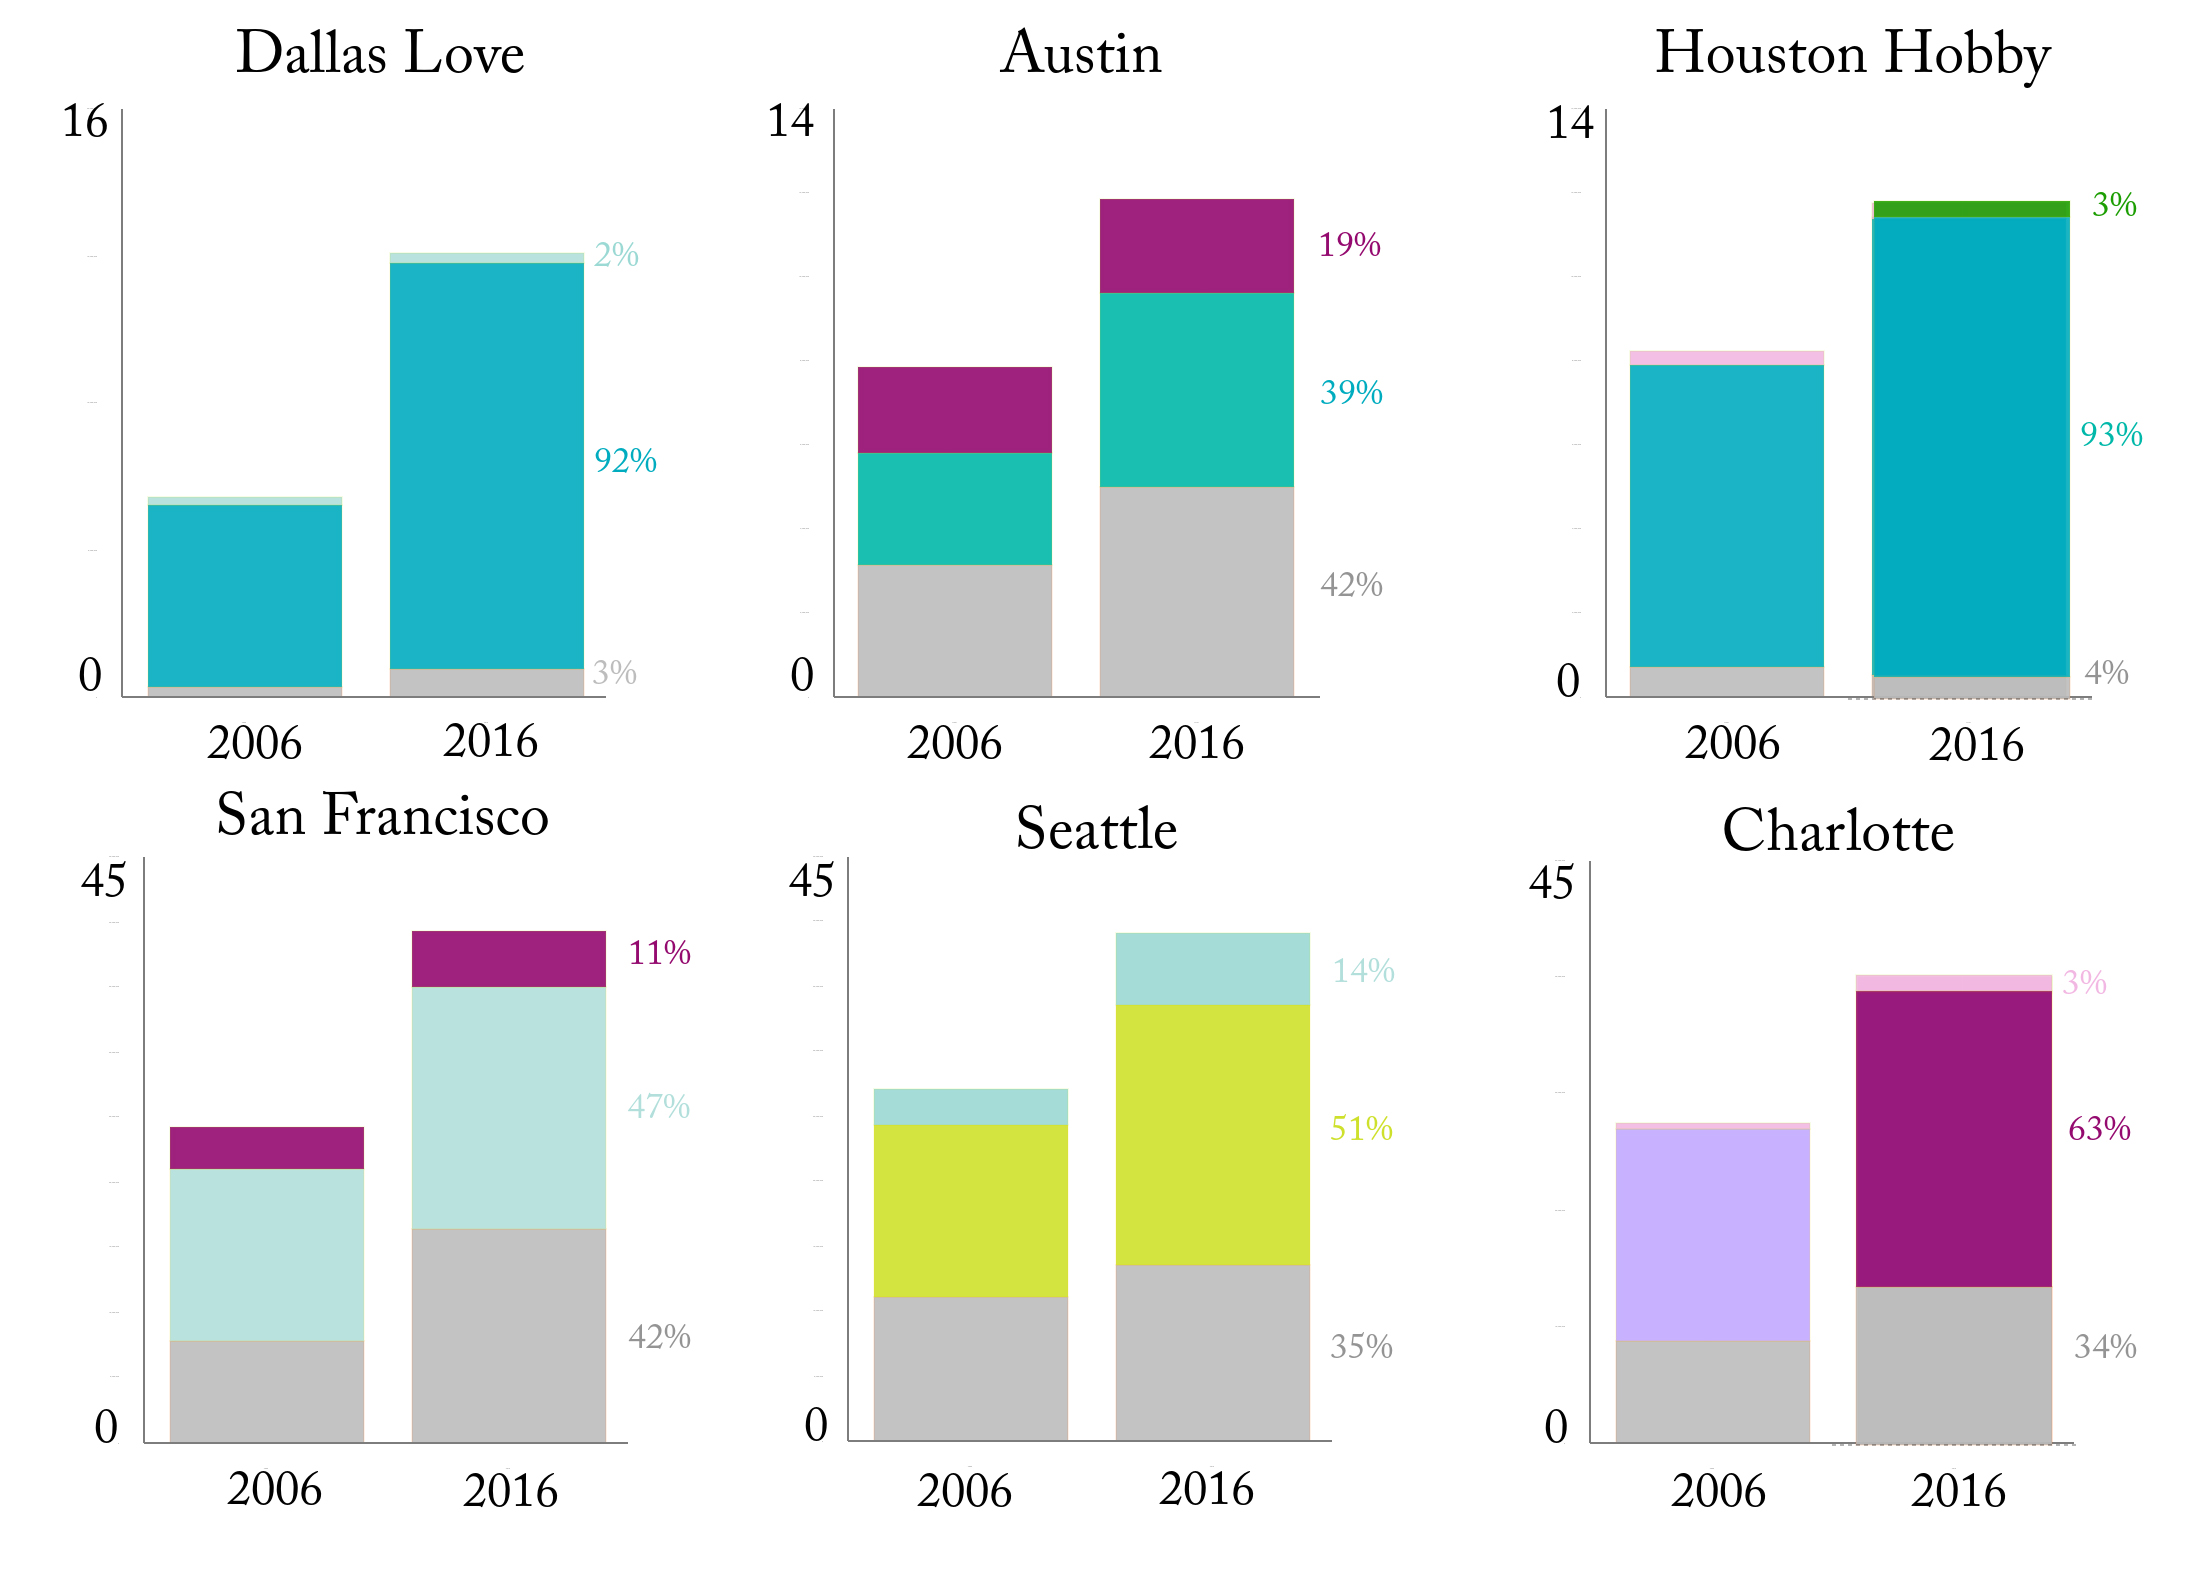
* In millions
Source: Bureau of Transportation Statistics, “Airport Snapshot”, U.S. Department of Transportation, 2017.

Figure 6. DECLINE: Share of passenger traffic for the first and second largest carriers at the six airports that had most passenger decline*
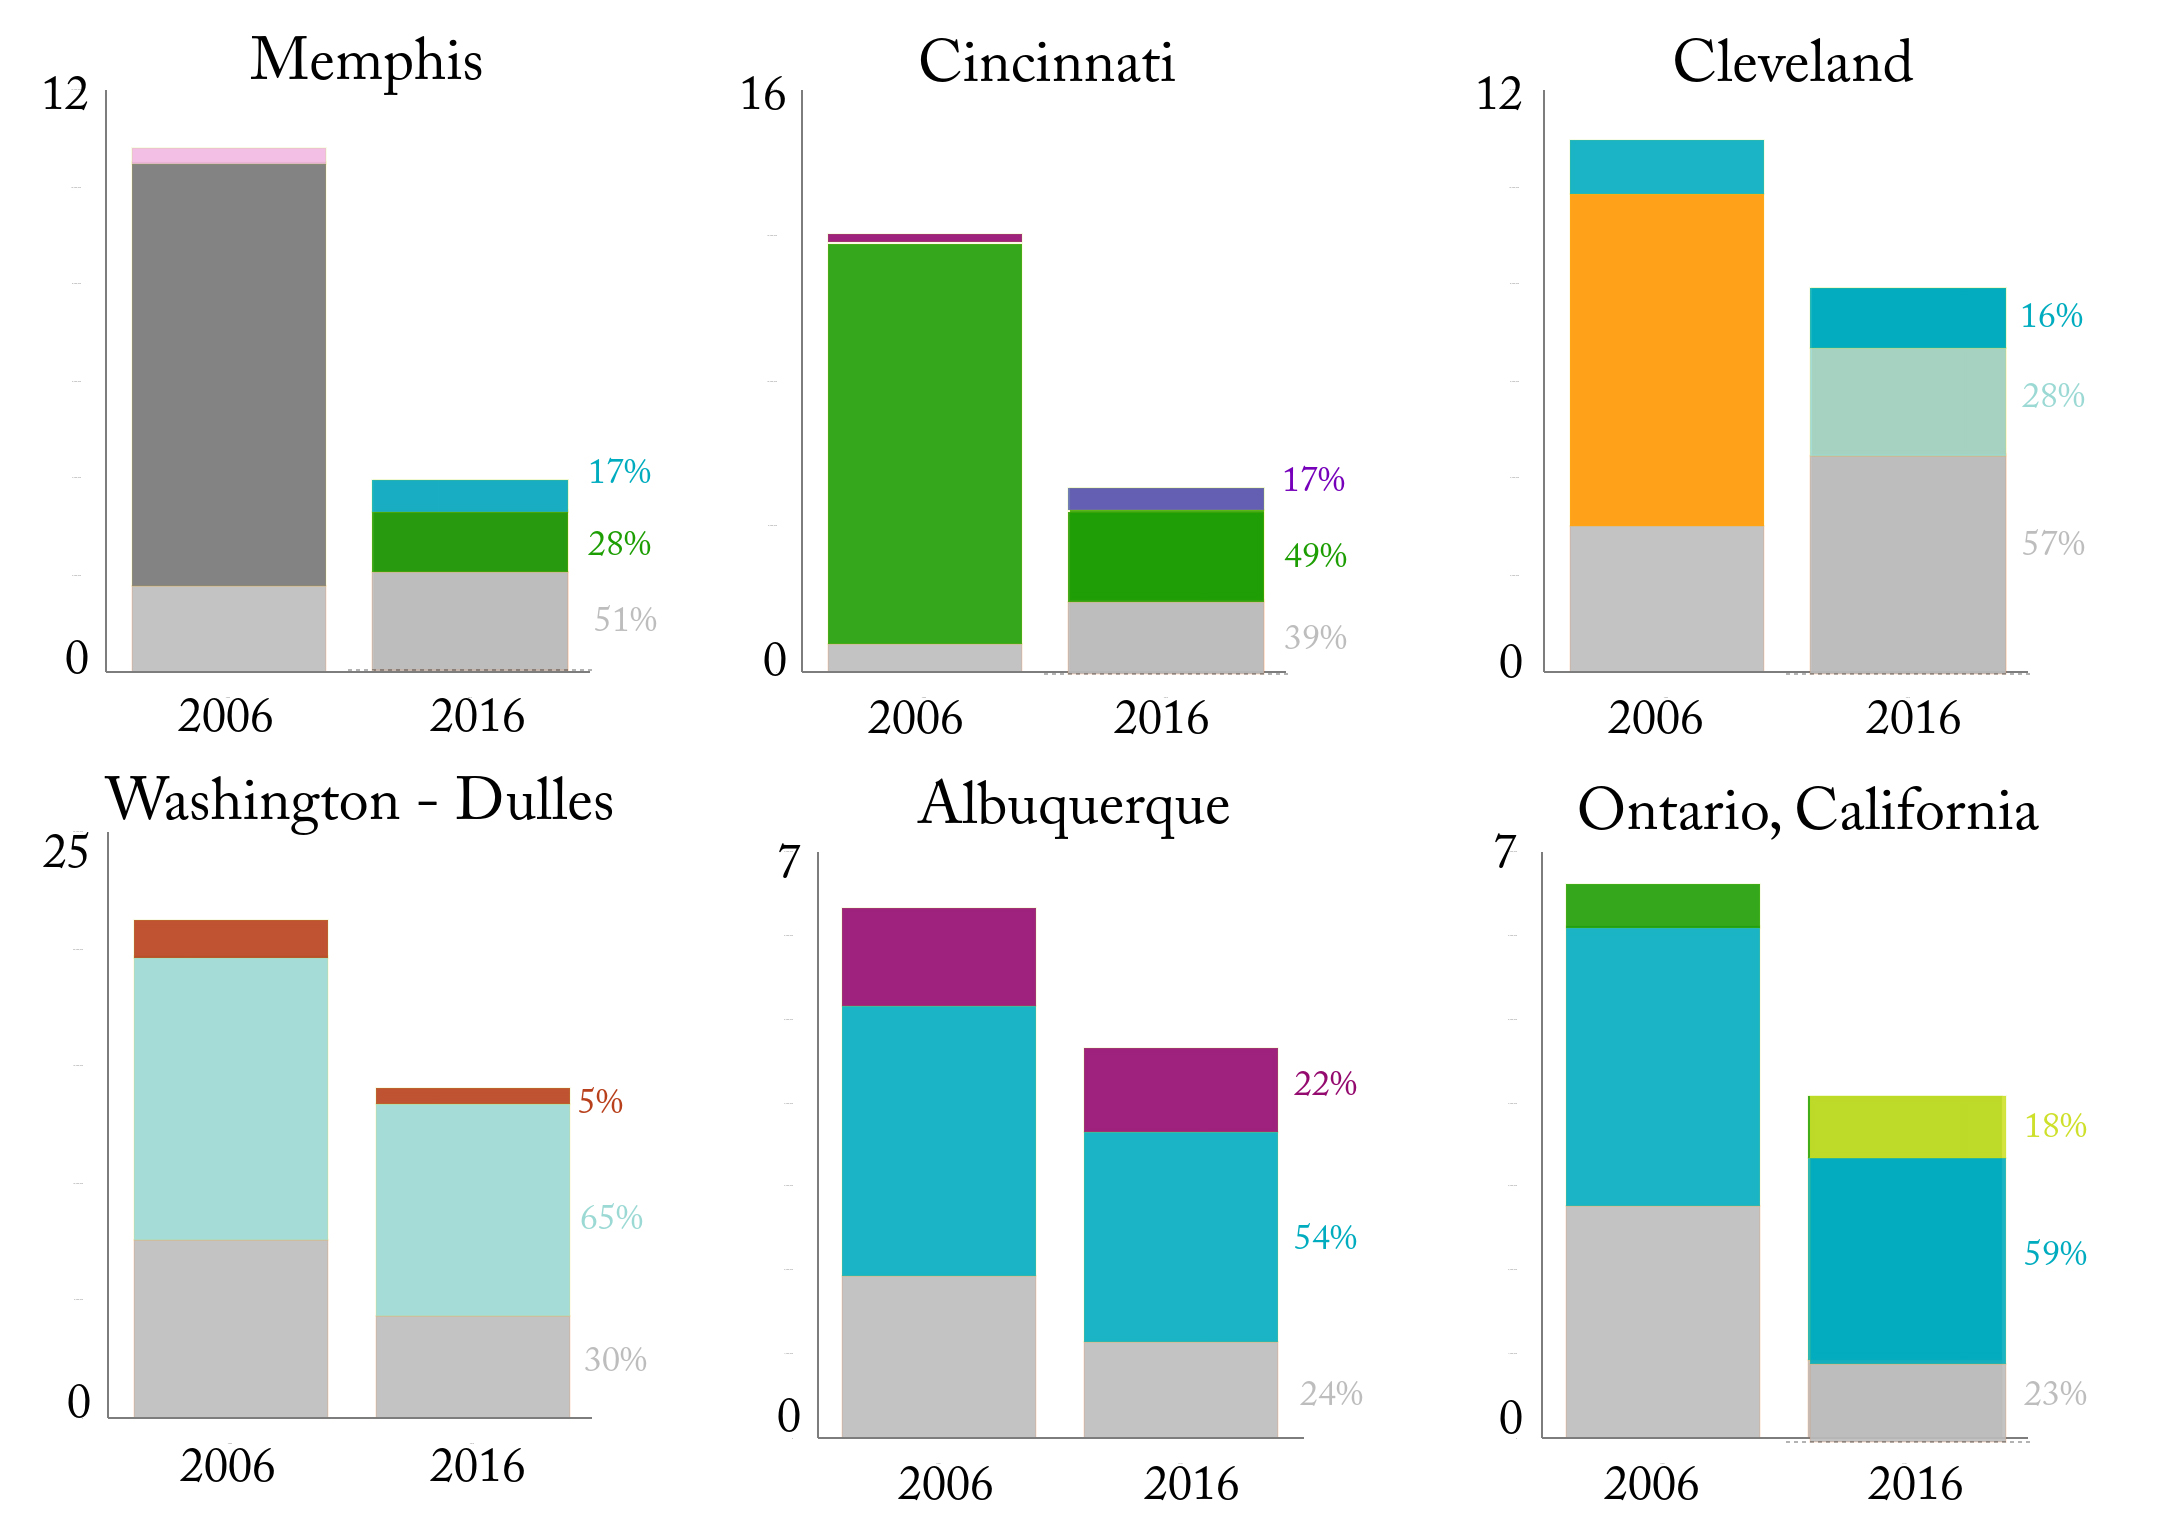
* In millions
Source: Bureau of Transportation Statistics, “Airport Snapshot”, U.S. Department of Transportation, 2017.
Table 3. Largest carriers at medium hubs (2016)
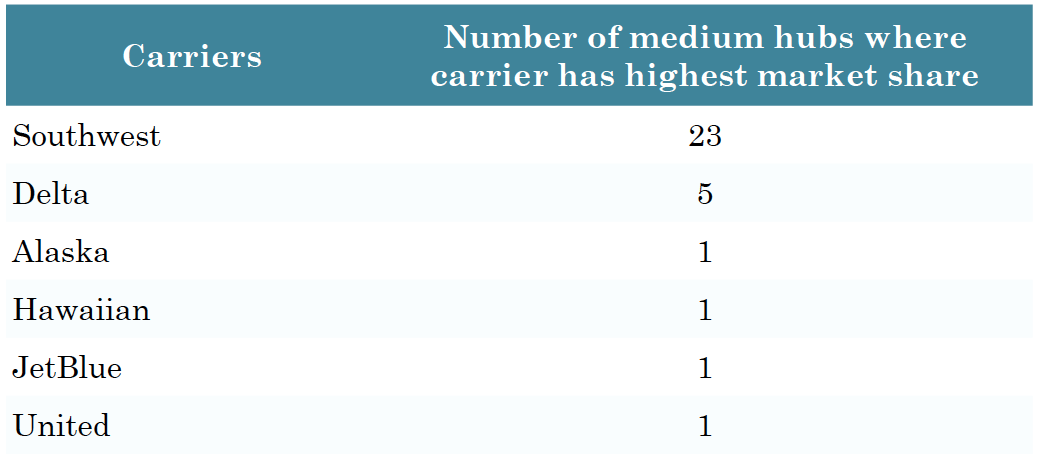
Source: Bureau of Transportation Statistics, “Airport Snapshot”, U.S. Department of Transportation, 2017.
Another factor that indicates the level of service is the frequency of flights in and out of metropolitan areas. Table 4 groups large and medium airports by metro area, and uses number of flights as a proxy for level of service. More flights indicate more destinations and more frequent, competitive service. The table calculates the number of flights relative to the metro area’s gross domestic product (GDP), demonstrating the size of the regional economy and the service that attracts.
To accommodate the growth in passengers, airlines have handled more passengers on fewer aircraft.[12] In fact, between 2006 and 2016, the 47 largest metro areas (all those served by medium and large hub airports) saw a decline of 11.3 percent in departing flights. Only seven (Austin, Charlotte, Miami, New Orleans, San Francisco, Seattle, and Tampa) saw an increase in total flights.
Table 4 tells very different stories for different metro regions, and regions fall in one of five distinct categories:
- Major hubs for major airlines. Regions like Charlotte, Denver, Atlanta, Phoenix, Chicago, and San Francisco have significantly more flights per regional GDP than the national median. In each of these cases, the airport is a major hub for one or more of the largest airlines in the United States. In these cases, many of the passengers at the airports are connecting to other flights.
- Major tourist destinations. Tourism accounts for nearly 50 percent of all flyers in the United States.13 Many of the airports that have more flights per regional GDP than the national median include popular destinations such as Las Vegas, Fort Myers, Orlando, and Nashville. These places would have higher flights per GDP regardless of consolidation due to their demand, shown by the diversity of airlines that serve them.[14]
- Large international gateways. Several large regions, such as Los Angeles, New York, Houston, and Washington, have fewer flights per regional GDP than the national average. This is in large part because the data only shows domestic flights, and each of these are major international gateway airports. Airports in the New York region as well as Washington Reagan and Los Angeles are also constrained for runway capacity, unlike other international hubs in Denver, Chicago, and Atlanta.[15]
- De-hubbed or de-emphasized airports. From 2006 to 2016 as airlines reduced flights at former hubs such as Cleveland, Pittsburgh, and Cincinnati, they all went from having flights per regional GDP above the national median, to significantly below it. Other cities that were not necessarily hubs experienced a loss in service as airlines de-emphasized traffic at those locations, including Philadelphia, Kansas City, Indianapolis, and Buffalo.
- Loss to nearby major hubs. Regions that include San Jose, Ontario, Milwaukee, and Hartford experienced declines in traffic as airlines consolidated service at larger airports nearby.
Table 4: Comparison of Regional GDP and Flight Frequencies
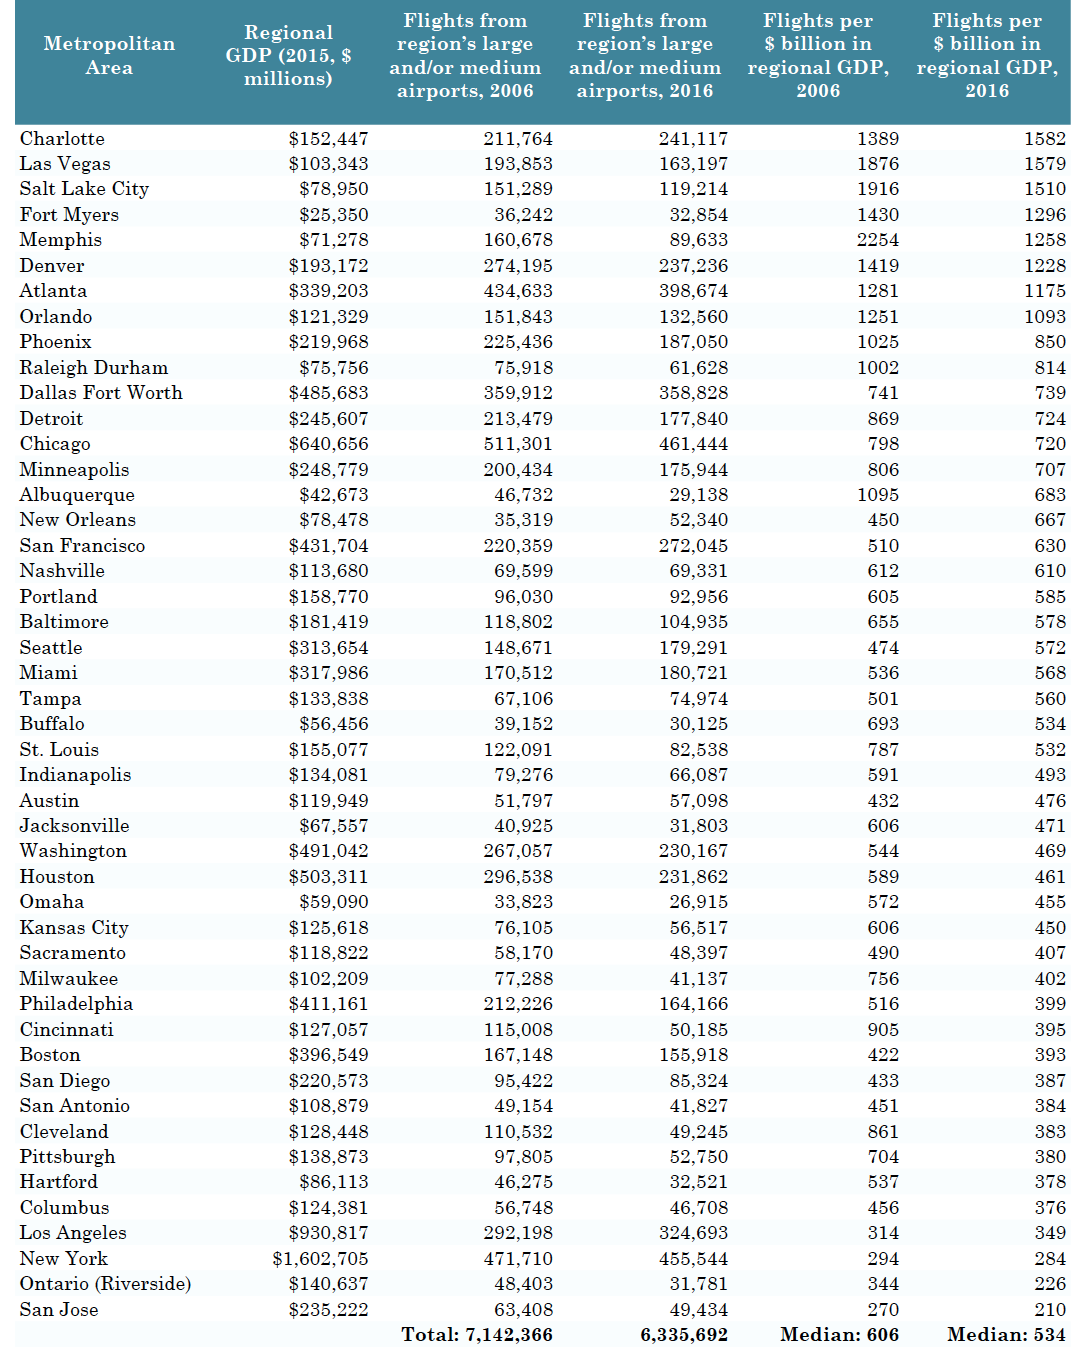
Sources: Bureau of Economic Analysis, “Regional Economic Accounts”, U.S. Department of Commerce, 2017 and Bureau of Transportation Statistics, “Airport Snapshot”, U.S. Department of Transportation, 2017.
How has air travel in specific metropolitan areas changed in recent years?
Answers:
• Over the last 15 years, large hubs fared well. Of all the large hubs, only Tampa and Chicago Midway experienced an increase in average fare and Washington Dulles was the only large hub to see a significant decline in domestic passengers.
• Meanwhile, nearly half of medium hubs experienced fare increases since 2001. While it used to be less expensive to fly out of an average medium hub airport, now the average fare for medium and large hubs are equal.
• Airports where traffic grew the most are in regions with robust economies such as San Francisco, Charlotte, and Seattle. Meanwhile airports that were former airline hubs like Cincinnati and Memphis saw dramatic declines in traffic.
• The relationship between the number of domestic flights to the health of each region reveals several different typologies of airports. Some large hubs and international gateways have strong ratios of traffic to GDP as do several popular tourist destinations. Other airports that lost their hub airline fell from having more flights per GDP than the national median in 2006 to significantly below it, except for Memphis, which fell but still has more flights than the median.
• More research is needed to understand the trends that affect air service in individual metropolitan areas. Since 2005, the airline industry has consolidated, the price of fuel has varied dramatically, the U.S. economy suffered and mostly recovered from the Great Recession, regional air lines have dealt with a chronic pilot shortages, and federal rules have changed. Any combination of these factors can affect the levels of service in specific markets.
Eno Aviation Insights Homepage
[1] Eno Center for Transportation, “What effect does airline consolidation have on passengers?” Eno Aviation Insights No. 4: November 2017.
[2] Ben Mutzabaugh, “Delta to Pull Plug on Memphis Hub after Labor Day,” USA Today, June 4, 2013; and Fangwu Wei and Tony Grubesic, “The Dehubbing Cincinnati/ Northern Kentucky International Airport (CVG): A Spatiotemporal Panorama,” Journal of Transport Geography, Vol 49. 85-98.
[3] Susan Glaser, “Cleveland Hopkins Rebounds from United Cuts, Sees Passenger Increase in 2015,” Cleveland Plain Dealer February 29, 2016.
[4] Some of this is driven by the growth in so-called Ultra Low Cost Carriers. See: Alexander R. Bachwich, “Airline Business Models 2006-2015: Trends and Key Impacts,” Massachusetts Institute of Technology, 2017.
[5] Eno Center for Transportation, “What effect does airline consolidation have on passengers?” Eno Aviation Insights No. 4: November 2017.
[6] Together, large and medium hubs carry around 88 percent of U.S. passengers each year. For a list of airports in each category see: Federal Aviation Administration, “Airport Categories”, 2017.
[7] This research uses 2005 as a starting point because that was when the first of several major airliner mergers occurred. See Eno Aviation Insights No. 4, “What effect does airline consolidation have on passengers,” November 1, 2017.
[8] Eno Center for Transportation, “What effect does airline consolidation have on passengers?” Eno Aviation Insights No. 4: November 2017.
[9] FAA/OST Task Force, “Airport Business Practices and Their Impact on Airline Competition,” U.S. Department of Transportation, 1999.
[10] The section does not explore changes in GDP and population in these cities, it purely looks at the aviation markets.
[11] Jessica Dyer, “Southwest Cutting 6 Flights for Albuquerque”, ABQ Journal, May 19, 2014.
[12] Eno Center for Transportation, “How Are Airlines Making Money?” Eno Aviation Insights No. 3: October 2017.
[13] John Heimlich, “Status of Air Travel in the USA,” Airlines for America, April 2016.
[14] Bureau of Transportation Statistics, “Airport Snapshot”, U.S. Department of Transportation, 2017.
[15] Eno Center for Transportation, “Addressing Future Capacity Needs in the U.S. Aviation System, November 2013.
Eno wishes to acknowledge its Aviation Working Group, a standing advisory body that provides Eno staff with guidance and expertise on all matters related to aviation policy. The opinions expressed are those of Eno and do not necessarily reflect the views of our supporters.