February 23, 2017
The Federal Highway Administration announced this week that in calendar year 2016, the total number of miles traveled by vehicles on all U.S. roads reached another all-time high of 3.218 trillion, above 2015’s 3.130 trillion, which itself was the highest since 2007’s 3.031 trillion. (The Great Recession and a variety of other factors caused an eight-year lag from 2008-2014 in the previously-inexorable increase in total VMT.)
The full Traffic Volume Trends report, which also breaks down 2016 totals by type of road and by state, is here. But VMT by itself is an incomplete measure. We decided to compare estimated VMT by a few other metrics. Here is how annual VMT looks divided by the total U.S. population (resident population of the 50 states and DC, as of the Census Bureau’s annual estimates of the July 1 population each year).
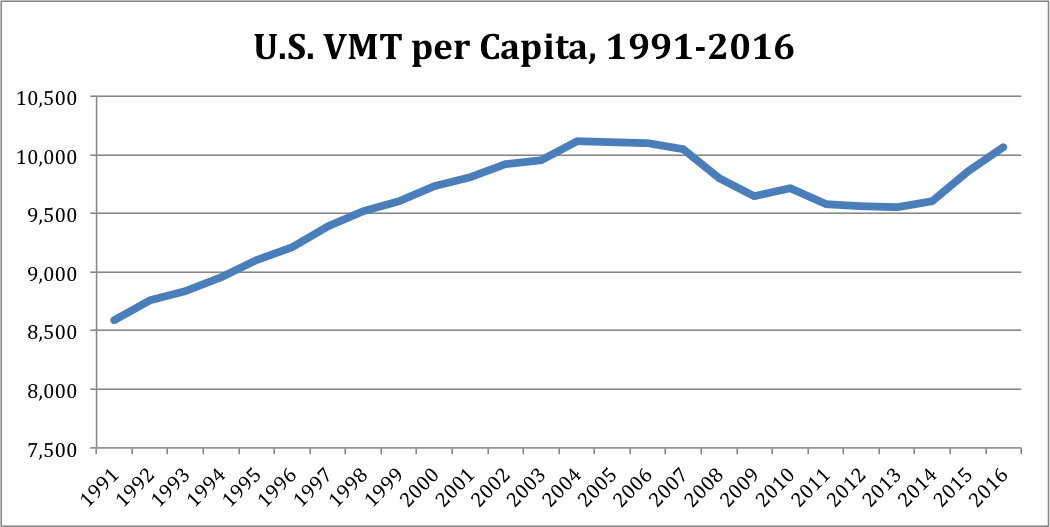
In 2016, VMT was 10,065 miles per capita – the highest that it has been since 2007’s 10,049 m.p.c. This still is not quite up to the all-time high of 10,117 m.p.c. in 2004. (Ed. Note: 2004 being the calendar year before Congress decided to spend Highway Trust Fund balances down to zero by 2010 in the SAFETEA-LU law, except that declining VMT accelerated that spend-down date to September 2008.)
Importantly, note that the rate of increase in VMT per capita over the last three years (an average of 1.7 percent per year) exceeds the average rate of increase over the 13-year 1992-2004 period (an average of 1.3 percent per year). So predictions of a perpetual decline in total VMT per capita appear unfounded – though we do need more updated information as to the type of VMT through 2016 that is not available yet.

The total VMT calculation includes all types of traffic – commuter car trips, pleasure rides, the trucking industry, motorcycles and buses (both intercity and local transit buses). In particular, the trucking industry has constituted about 9 percent of total VMT over the 2011-2014 period (a change in methodology by USDOT in 2007 makes it difficult to compare types of VMT prior to that point). So even though FHWA has data for the total number of licensed drivers in the U.S., comparing VMT to licensed drivers is not as representative of the economy as a whole (and, in any case, FHWA’s drivers license estimates for 2016 aren’t in yet). Anyway, the ratio of total resident population to total licensed drivers changes remarkably little year-to-year (since 1991, it has zagged back and forth between 1.501 to 1.454 total resident population to licensed drivers, with 2015 dropping sharply after a rebound in 2012-2015).
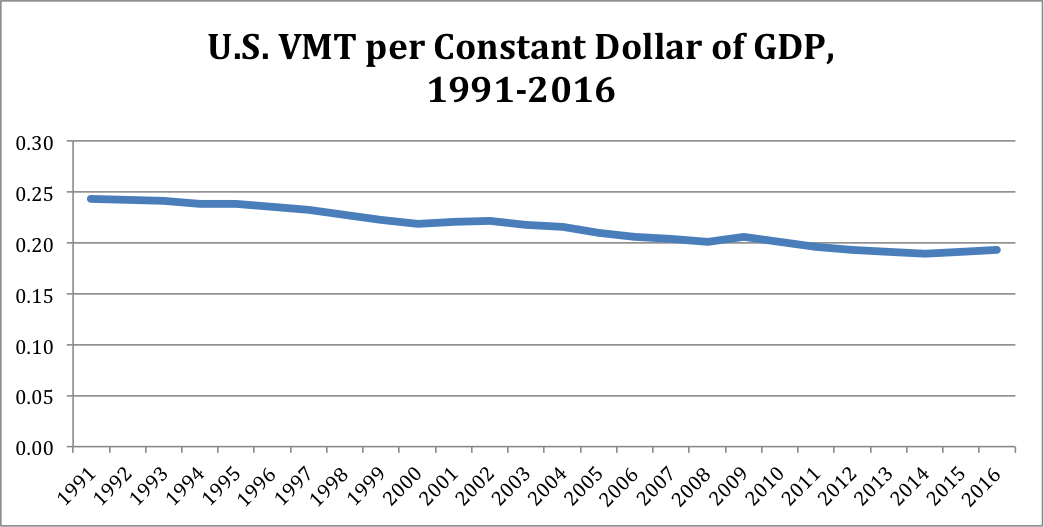
Comparing VMT to the economy as a whole is complicated – VMT is both required to produce economic value (commuting to work, freight transportation) and is also an end product of a growing economy (leisure travel). And increases in telecommuting, carpooling and mass transit usage can also increase the efficiency of the economy in producing output per VMT. When comparing total U.S. VMT to the total economy (in terms of dollars of gross domestic product), it appears that the economy has grown more efficient in utilizing road transportation in the last 25 years. In 1991, every dollar of GDP required or enabled just under one-fourth of one mile of VMT (0.243). That has declined over the years – now a dollar of GDP only requires or enables just under one-fifth of one mile of VMT (0.193).
(These are constant dollars of GDP based on the chained 2009 value of a dollar, from the Bureau of Economic Analysis.)