USDOT Launches New Data Initiative to Predict (and Maybe Prevent) Fatal Crashes
January 19, 2018
Data, as the saying goes, is the new oil.
The private sector is constantly collecting and processing data to better understand business operations, consumer preferences, and economic trends. Often, well-refined data leads to more efficient and more profitable companies.
The public sector also collects a significant amount of data, but it often stops there. Limited workforces and funding mean that government agencies are typically unable to take on the types of data analysis projects as the private sector. The U.S. Department of Transportation (USDOT) alone has 750 national data sets that remain siloed and unrefined – a vast amount of potential energy that lies dormant.
A new USDOT initiative seeks to reverse this trend by adopting a private sector approach to data – turning a moneymaking strategy into a potentially lifesaving action.
(Source: USDOT Twitter)
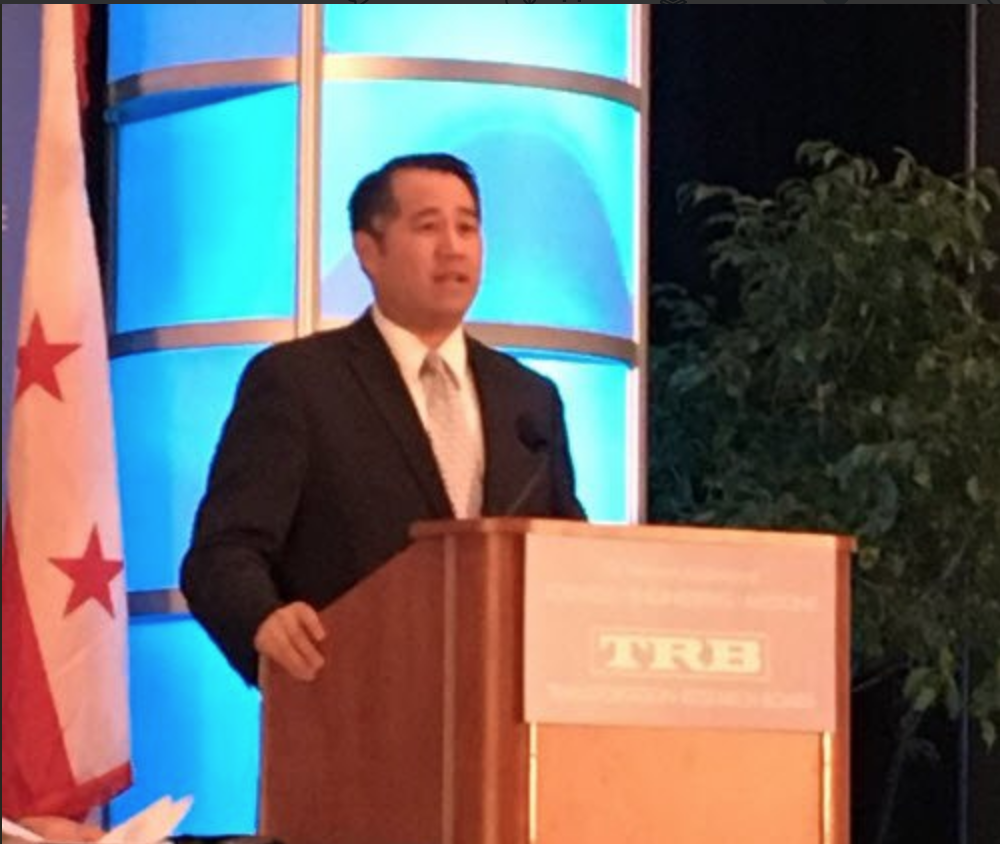
On January 8, Derek Kan, the Under Secretary of Transportation for Policy, announced a new USDOT safety data initiative intended to merge 21st century data sets with the data that the department has been collecting for generations. If successful, this will break down the silos between its data sets to understand the factors that lead to fatal crashes and, in the process, learn how to predict and mitigate risks ahead of time.
The idea is not so far-fetched: the Chinese ride-sharing company Didi has already developed the ability to predict demand for its services about 15 minutes in advance, and how much congestion there will be, with 85 percent accuracy. By comparing previously accumulated traffic data with real-time data about road conditions, Didi can dispatch cars to specific areas ahead of time to reduce wait times for customers and the time that drivers spend in traffic.
USDOT has a three-point plan to transform its data sets from rows and columns into understanding and action. The ultimate objective is to identify 3-5 proximate factors that contribute to fatal car accidents, and then work with states and cities to mitigate them.
The first part involves creating visualizations of its data sets to understand the relationships between different factors that contribute to fatal collisions (e.g., weather, time of day, road quality). USDOT has already drawn on the expertise of tech firms to explore how this could be accomplished.
The next piece is the integration of private sector solutions, like the navigation app Waze, to gather data in real time and compare it with historical data to predict the likelihood of collisions and unsafe road conditions ahead of time.
The final and most ambitious piece is preparing for artificial intelligence applications that can sift through vast quantities of data to find links between less obvious factors that contribute to collisions.
During his announcement at the Transportation Research Board Annual Meeting last week, Kan said that the initiative would begin with two pilot projects.
The first project will help USDOT to better understand how vehicle speed, speed differentials, and roadway characteristics factor into fatal crashes. GPS-enabled devices will collect anonymized data on the prevailing speeds of vehicles across the entire National Highway System every 5 minutes. This will be the first time that USDOT has conducted such a study on a national scale.
The second pilot will leverage roadway hazard reports from Waze users on the road and USDOT’s historical crash data to estimate crash risks ahead of time. This might not only predict the likelihood of a crash, but also could present opportunities to mitigate those risks ahead of time by notifying drivers using the app.
Beyond the Spreadsheet
Most fatal crashes are caused by one of three driver behaviors: driving under the influence, speeding, and not wearing a seat belt. For decades, the National Highway Traffic Safety Administration (NHTSA) and other modal administrations have fought to reduce these behaviors through grant programs, public education, and collaboration with state and local authorities.
By and large, these initiatives have been successful in reducing those three behaviors. Seat belt use, for example, now hovers around 90 percent. At first glance, it might seem that this means 100 percent seat belt use is within reach. But the unfortunate truth is that the marginal cost of this initiative balloons when pursuing the last 10 percent of holdouts.
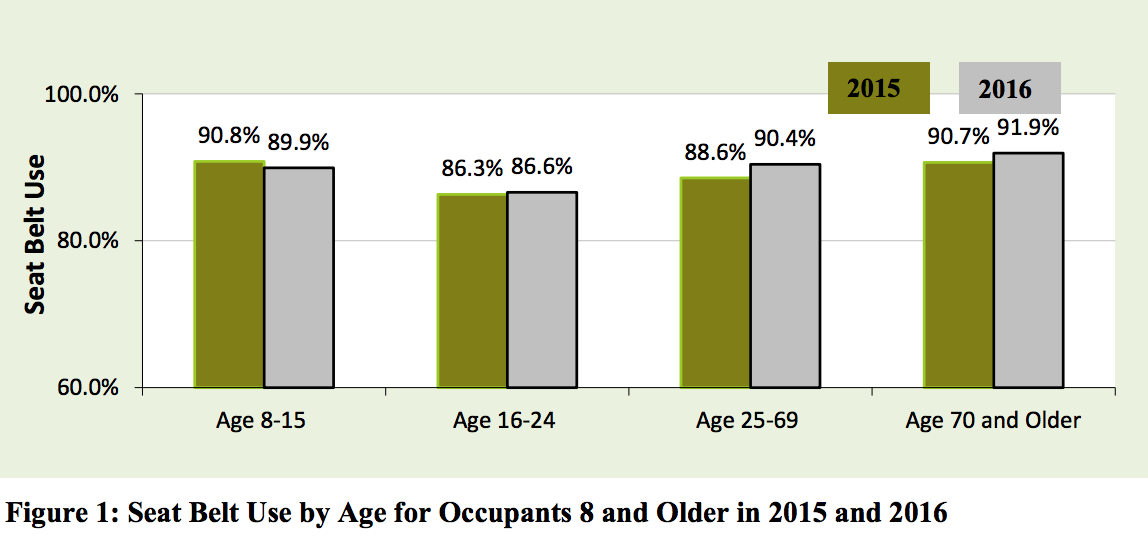
(Source: Occupant Restraint Use in 2016 – NHTSA)
Of course, USDOT will continue to focus on these issues and find new ways to address them by supporting the development of emerging technologies like automated vehicles. But instead of blowing through NHTSA’s operational budget to clamber up to 100 percent seat belt use (which, for the record, is virtually impossible), the safety data initiative will identify the proximate factors that contribute to fatal collisions, which may be mitigated more easily and at a lower cost.
USDOT, like many federal agencies, has been collecting reams of data for decades – well before many of the data-driven startups in Silicon Valley today (and perhaps some of their founders) even existed. This includes information about everything from the condition of the nation’s highways to crashes involving pedestrians to a catalog of all highway-rail crossings.
The jewel in the crown is the Fatality Analysis Reporting System (FARS), a nationwide census of every traffic death in the United States that is published annually.
These reports, which are completed by first responders, include all of the immediate circumstances related to the incident. As shown in the example below, FARS reports are released in annual batches that include factors such as the approximate time of the crash, whether alcohol was involved, weather conditions, and even the latitude and longitude where it occurred.
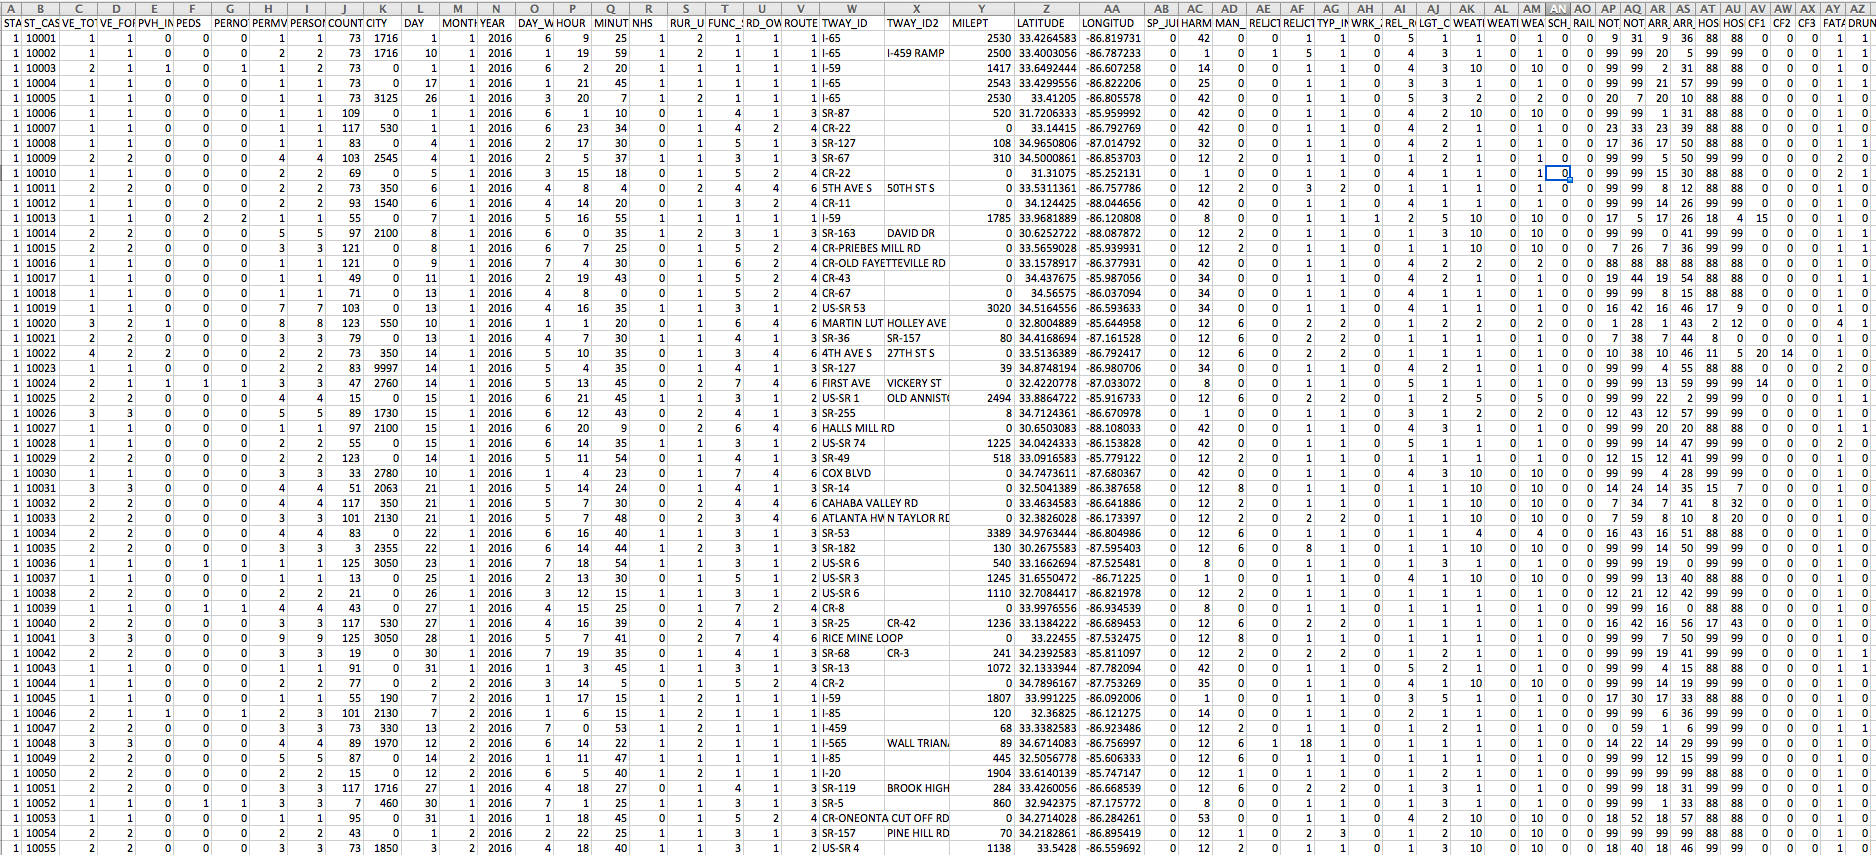
(Source: National FARS Reports, 2016 – NHTSA FARS Database)
There is no shortage of details in the reports (quite the contrary). But FARS only tells the end of the story and not the events leading up to it, like the condition of the road or whether the sun may have been in the driver’s eyes.
For example: an analysis of the 2016 FARS report might show that, on a national scale, traffic deaths are more likely to happen at night. However, it does not explicitly reveal the other factors that may have contributed to these crashes – perhaps drivers could not see the traffic signals or pavement markings in the dark or, even worse, they weren’t there at all.
But if USDOT could analyze FARS data and examine proximate factors, it could then create a forum to work on preventing future fatal collisions with law enforcement, municipalities, and state agencies.
This kind of collaboration has already improved safety in commercial aviation, which had its safest year on record last year with zero deaths reported for passenger jet travel. Through the Aviation Safety Information Analysis and Sharing (ASIAS) System, airlines report information about incidents to the Federal Aviation Administration (FAA). Stakeholders are encouraged to submit reports about incidents, regardless of severity, in order to identify potential safety risks ahead of time. By proactively sharing this data, the FAA and airlines are empowered to identify potential problem areas and address them ahead of time – making aviation an even safer more in the process.
The fact that incorporating data collection and predictive analytics has already been successful in aviation illustrates just how much USDOT’s initiative could enhance the safety of other modes.
USDOT may not be able to buckle every American’s seatbelt, take car keys from every would-be drunk driver, or personally urge lead-footed drivers to slow down. But, with a little modernization, it just might be able to prevent the tremendous loss of more than 35,000 lives on American roadways every year.

