New data released last week by the Bureau of Transportation Statistics estimated that the number of Americans employed in the transportation-related labor force grew to 14.508 million in 2018, an increase of 362 thousand (+2.6 percent) over 2017. This was a faster growth rate than the national labor force as a whole, which only grew by 1.7 percent over 2017.
The transportation-related labor force is a very broad category, covering not only persons who actually provide transportation services, but also warehousing, transportation-related manufacturing, transportation-related construction, people who sell vehicles and fuel, repair shops, parking attendants, and postal and government employees.
The whole thing is based largely on the NAICS classification system. NAICS codes 48 and 49 are “transportation and warehousing,” defined as “The Transportation and Warehousing sector includes industries providing transportation of passengers and cargo, warehousing and storage for goods, scenic and sightseeing transportation, and support activities related to modes of transportation. Establishments in these industries use transportation equipment or transportation related facilities as a productive asset. The type of equipment depends on the mode of transportation. The modes of transportation are air, rail, water, road, and pipeline.” Then each code is broken down into a bunch of three-digit subsectors and four-digit sub-subsectors.
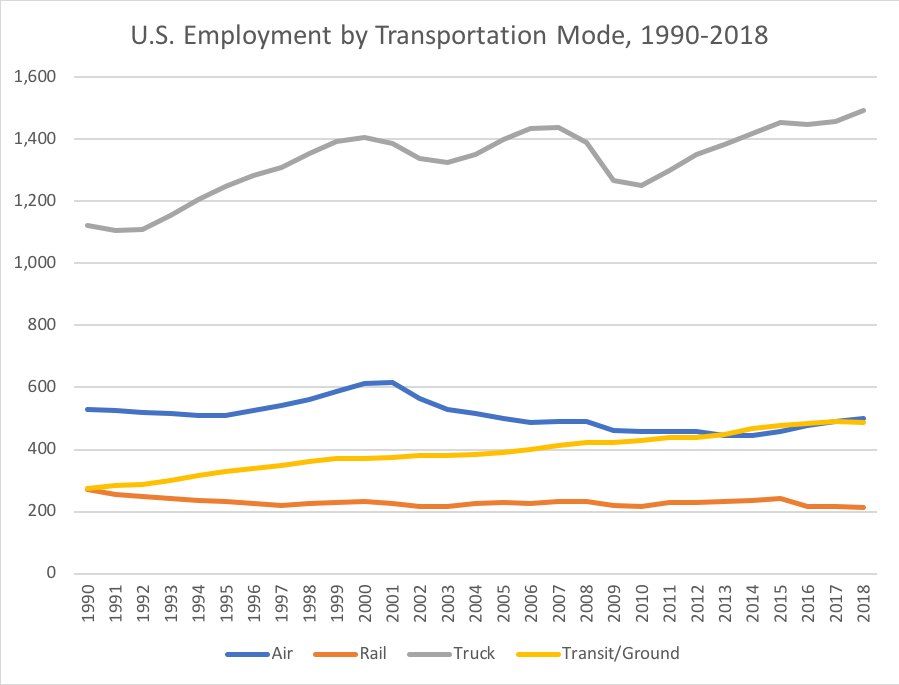
In terms of your classic transportation service provider jobs, by mode, air transportation jobs increased 2.0 percent in 2018, trucking jobs increased 2.4 percent, rail transportation jobs decreased 0.5 percent, and the catchall “transit and ground passenger transportation” category (which includes not only transit workers but school bus drivers, charter buses, taxi and limo workers, and a catchall “other” category that may include TNC drivers) decreased 0.3 percent.
In terms of thousands of jobs, here is the NAICS breakdown.
| 48-49. Transportation and Warehousing. |
2017 |
2018 |
Change |
|
|
481. Air Transportation |
491.5 |
501.3 |
+9.8 |
+2.0% |
|
482. Rail Transportation |
215.1 |
214.1 |
-1.0 |
-0.5% |
|
483. Water Transportation |
65.0 |
64.8 |
-0.2 |
-0.3% |
|
484. Truck Transportation |
1,457.0 |
1,491.9 |
+34.9 |
+2.4% |
|
485. Transit/Ground Passenger Transportation |
488.9 |
487.5 |
-1.4 |
-0.3% |
|
486. Pipeline Transportation |
48.8 |
48.5 |
-0.3 |
-0.6% |
|
487. Scenic/Sightseeing Transportation |
35.2 |
34.2 |
-1.0 |
-2.8% |
|
488. Support Activities for Transportation |
689.9 |
711.8 |
+21.9 |
+3.2% |
|
491. Postal Service. |
615.4 |
608.6 |
-6.8 |
-1.1% |
|
492. Couriers and Messengers |
676.1 |
725.4 |
+49.3 |
+7.3% |
|
493. Warehousing and Storage |
1,027.3 |
1,139.6 |
+112.3 |
+10.9% |
|
Total, Codes 48-49 |
7,827.2 |
8,045.7 |
+218.5 |
+2.8% |
For the air, rail, truck and transit/ground categories, here are the 1990 to present trend lines, in thousands of jobs.
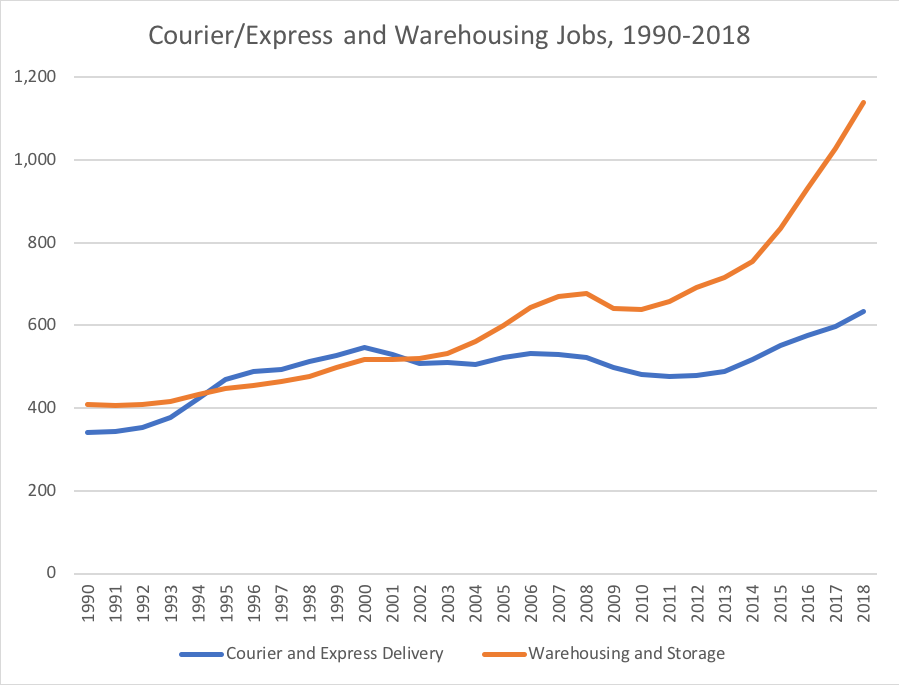
But for sheer growth, you have to check out the warehousing sector.
Other transportation-related jobs include those in the construction sector (NAICS 23), manufacturing sector (NAICS 31-33) and the wholesale trade (NAICS 42) and retail trade (NAICS 44-45) sectors. And there are even some in the “other services” (NAICS 81) sector. Some of those highlights are below, in thousands of jobs.
|
2017 |
2018 |
Change |
|
| 2373. Highway, Street, and Bridge Construction |
327.7 |
343.9 |
+16.2 |
+4.9% |
| 324. Petroleum and Coal Products Manufacturing |
114.6 |
115.6 |
+1.0 |
+0.9% |
| 3361. Motor Vehicle Manufacturing |
218.9 |
233.6 |
+14.7 |
+6.7% |
| 3362. Motor Vehicle Body/Trailer Manufacturing |
155.3 |
165.3 |
+10.0 |
+6.4% |
| 3363. Motor Vehicle Parts Manufacturing |
589.2 |
597.1 |
+7.9 |
+1.3% |
| 3364. Aerospace Product/Parts Manufacturing |
488.1 |
509.4 |
+21.3 |
+4.4% |
| 3366. Ship and Boat Building |
134.5 |
139.4 |
+4.9 |
+3.6% |
| 3365-69. Rolling Stock/Other Transport Manuf. |
57.3 |
57.6 |
+0.3 |
+0.5% |
| 441. Motor Vehicle Parts Dealers |
2,004.6 |
2,021.2 |
+16.6 |
+0.8% |
| 447. Gasoline Stations |
929.8 |
934.0 |
+4.2 |
+0.5% |
| 8111. Auto Repair and Maintenance |
925.7 |
937.8 |
+12.1 |
+1.3% |
| 81293. Parking Lots and Garages |
140.8 |
146.6 |
+5.8 |
+4.1% |
(The rest of the updates to National Transportation Statistics that were released on October 30 are here, for all you data junkies out there.)

