U.S. Gasoline Use Hit All-Time High in FY 2022
The volume of motor gasoline in the United States hit an all-time high in the just-completed fiscal year 2022, with oil companies producing and distributing about 6.8 billion gallons more than they did in the previous peak year of fiscal 2018.
We come at these figures secondhand through the year-end Treasury Department report for the Highway Trust Fund (HTF), released this week. Net tax receipts from the federal excise tax on gasoline deposited in the Trust Fund totaled $27.500 billion in fiscal year 2022, exceeding the previous high of $26.250 billion in FY 2018 (+4.8%).
The federal excise tax rate on gasoline for the HTF has been the same since 1993, at 18.3 cents per gallon. Simply dividing the annual tax receipt total by 0.183 gives 150.3 billion taxable gallons of gasoline in 2022, compared to 143.4 billion gallons in 2018, for an increase of 6.8 billion gallons.
The federal excise tax is not collected at the pump. It is collected at the refinery or the wholesale tank farm, depending on business structure. So one cannot conclusively say that motorists used an all-time high number of gallons in FY 2022. But there isn’t that much storage in the system, and oil companies have been trying to get gas to customers as fast as possible, so the highway use number, when it comes in, should be pretty close to this.
Diesel tax receipts were also an all-time high of $12.2 billion, but this was more expected and was only a 1.1 percent increase over the prior year. Gasoline was a 7.7 percent increase over 2021, but 2021 was still showing some COVID travel demand depression.
Total Highway Trust Fund tax receipts, compared to the previous decade, are shown below.
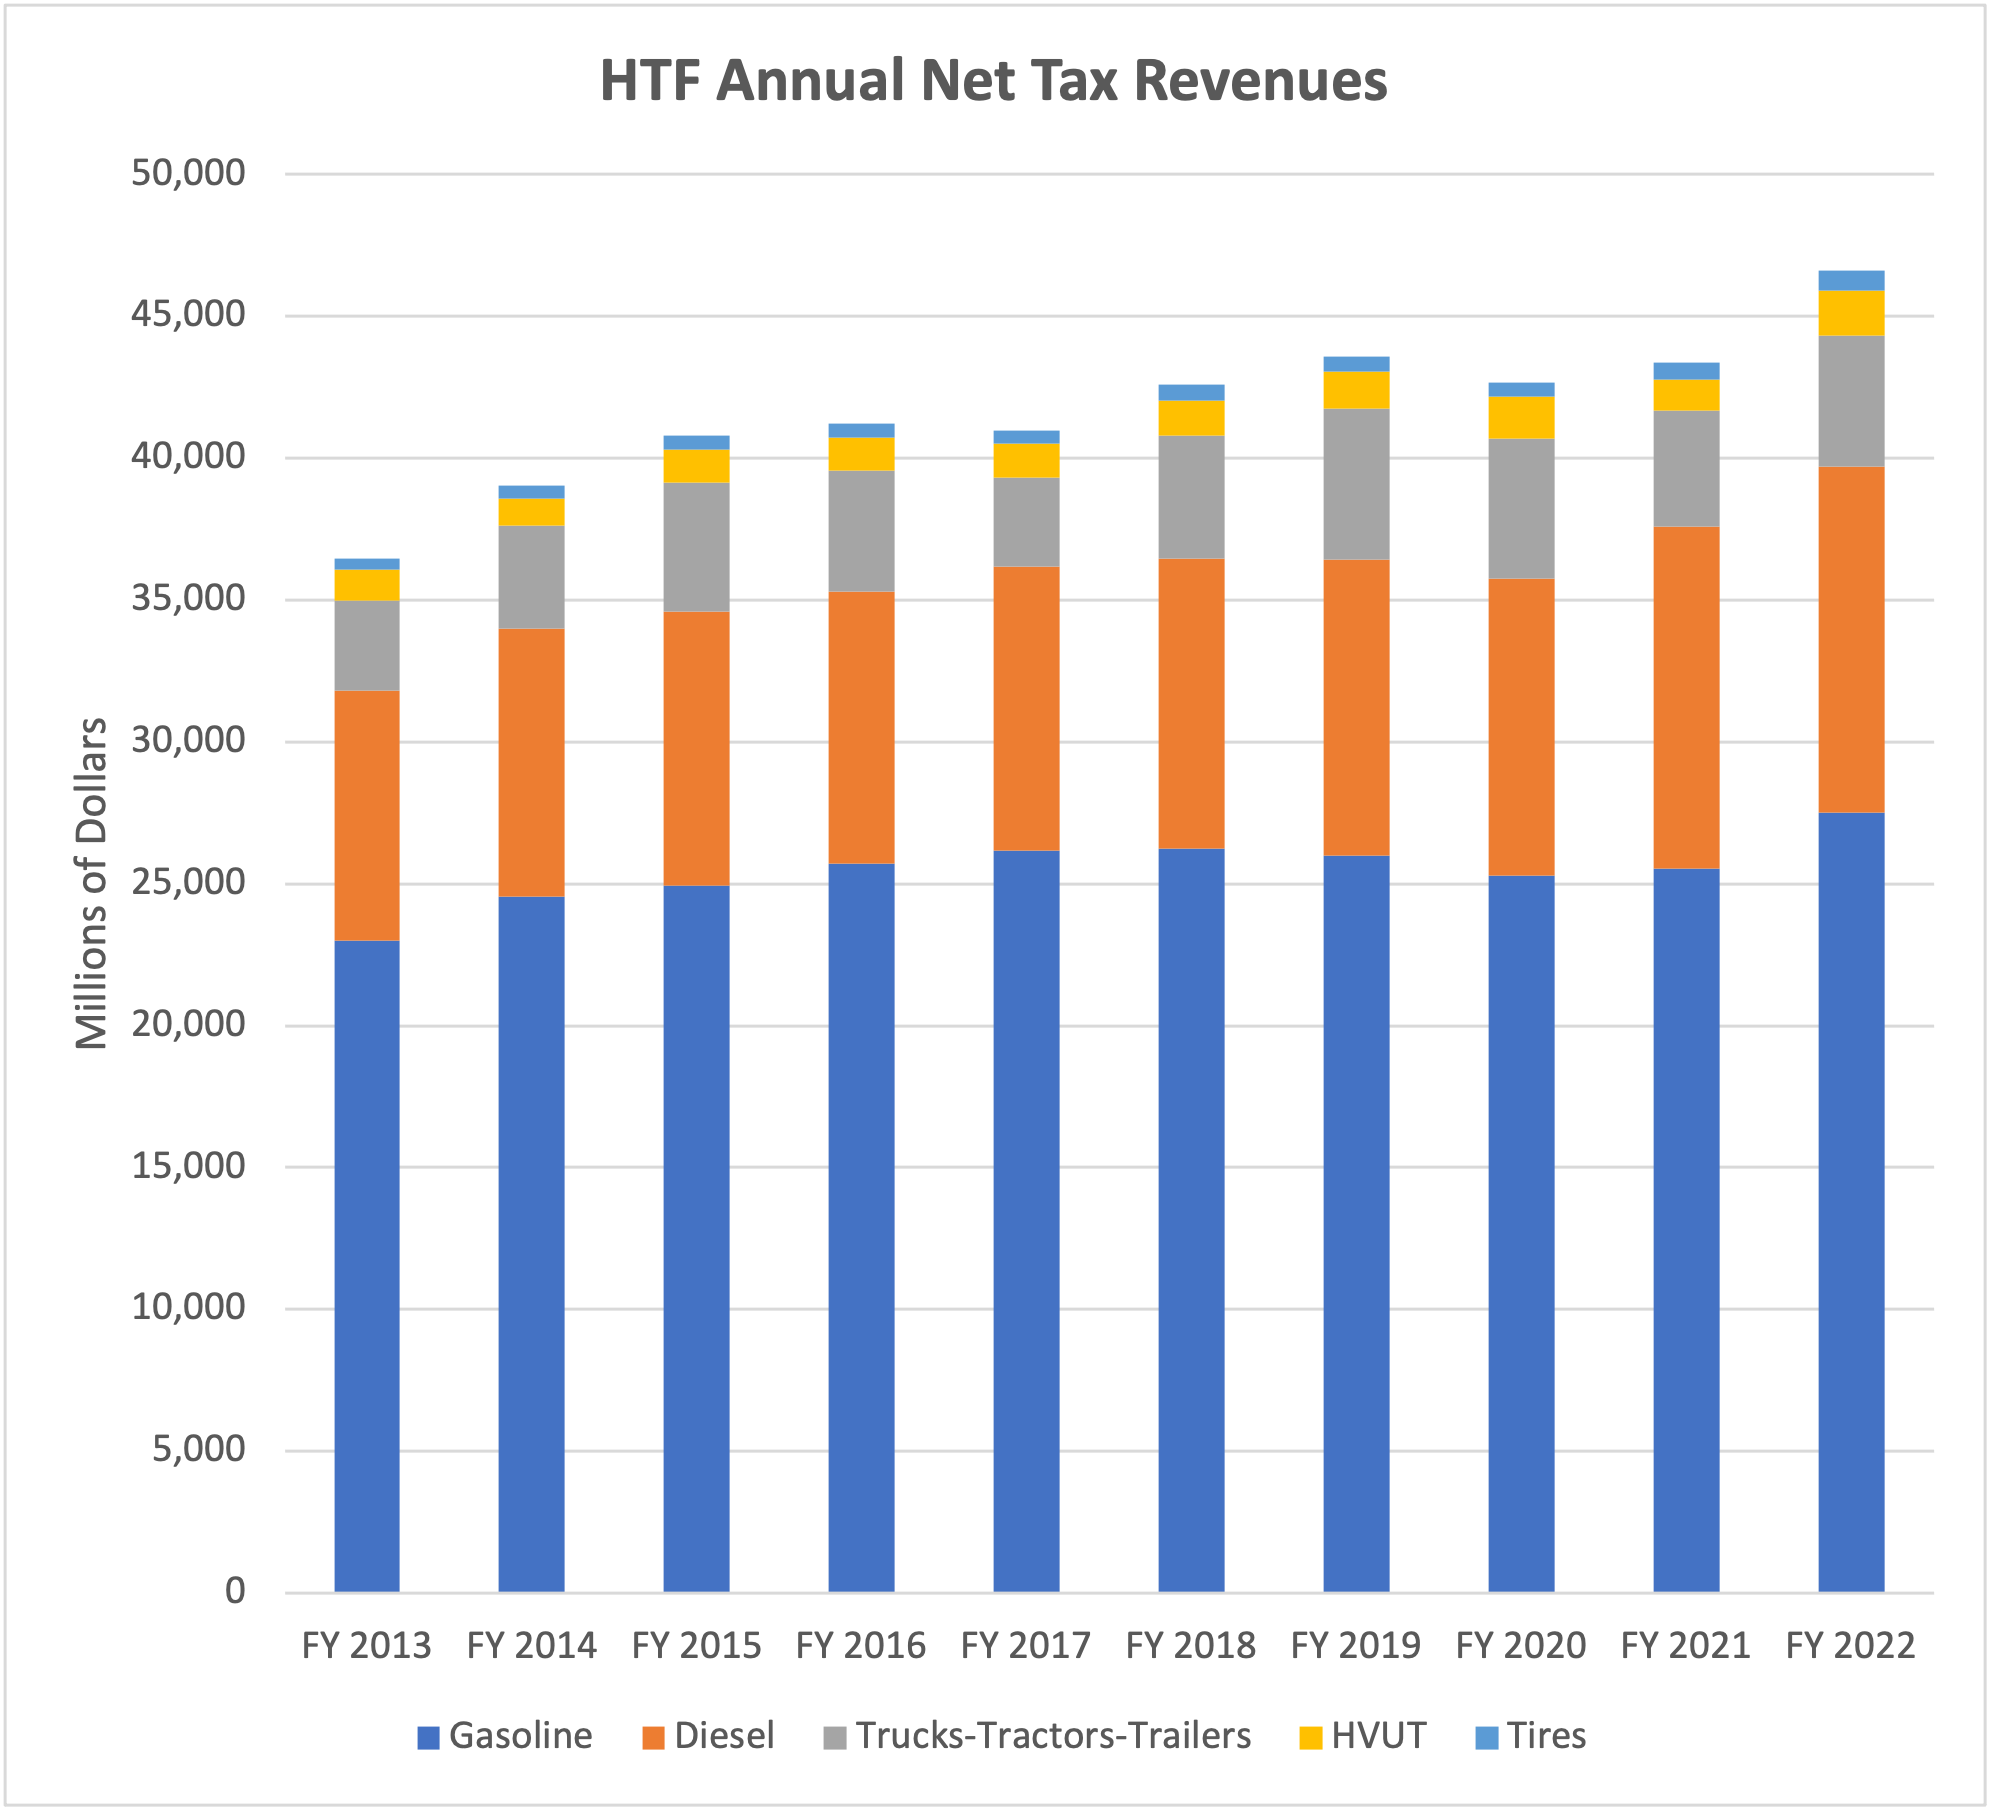
| Highway Trust Fund Net Tax Revenues – Millions of Dollars | ||||||
| Gasoline | Diesel | Truck/ Tractor/ Trailer | HVUT | Tires | TOTAL | |
| FY 2013 | 23,003 | 8,798 | 3,197 | 1,091 | 359 | 36,448 |
| FY 2014 | 24,540 | 9,454 | 3,645 | 945 | 447 | 39,031 |
| FY 2015 | 24,934 | 9,657 | 4,554 | 1,150 | 501 | 40,796 |
| FY 2016 | 25,708 | 9,585 | 4,266 | 1,188 | 478 | 41,224 |
| FY 2017 | 26,172 | 10,013 | 3,117 | 1,206 | 476 | 40,984 |
| FY 2018 | 26,250 | 10,213 | 4,337 | 1,247 | 540 | 42,587 |
| FY 2019 | 26,011 | 10,414 | 5,330 | 1,285 | 535 | 43,574 |
| FY 2020 | 25,289 | 10,467 | 4,951 | 1,453 | 507 | 42,667 |
| FY 2021 | 25,533 | 12,058 | 4,089 | 1,087 | 591 | 43,358 |
| FY 2022 | 27,500 | 12,191 | 4,623 | 1,585 | 713 | 46,613 |

