U.S. Gasoline Production Stabilizes At 12% Below Last Year’s Levels
The latest weekly production reports from the Energy Department show that the production of gasoline by U.S. refineries and blenders has stabilized at a level around 12 percent below last year’s production levels. This follows a period during the initial coronavirus travel restrictions where production dropped by 40 percent below last year’s levels before slowly inching back up since late April.
For the last six weeks – from the week ending June 26 through the week ending July 31 – production of finished motor gasoline has averaged between 13 and 10 percent per week below the comparable levels in 2019. And the trend has been towards increased production – the week ending June 26, production was 13 percent below last year, and that went to 12 percent down in the week ending July 3 10 percent in the week ending July 10, 12 percent in the week ending July 17, 10 percent in the week ending July 24, and 12 percent below 2019 levels last week.
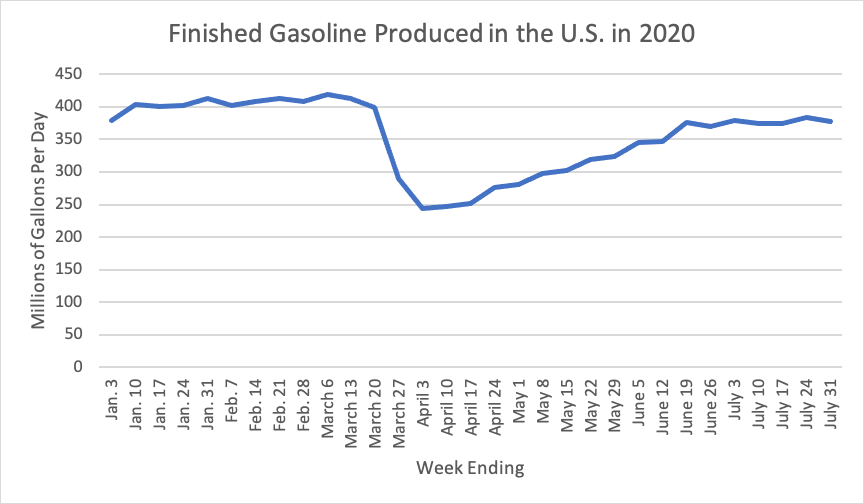
Total U.S. production of finished motor gasoline, on a weekly basis, for 2020 looks like this:
There is not a direct correlation between gasoline consumption and gasoline production – there is a lead time of a few weeks from the time production decisions are made to the time the fuel arrives at a service station. This helpful graphic from the an American Petroleum Institute presentation shows the process for various types of fuel:
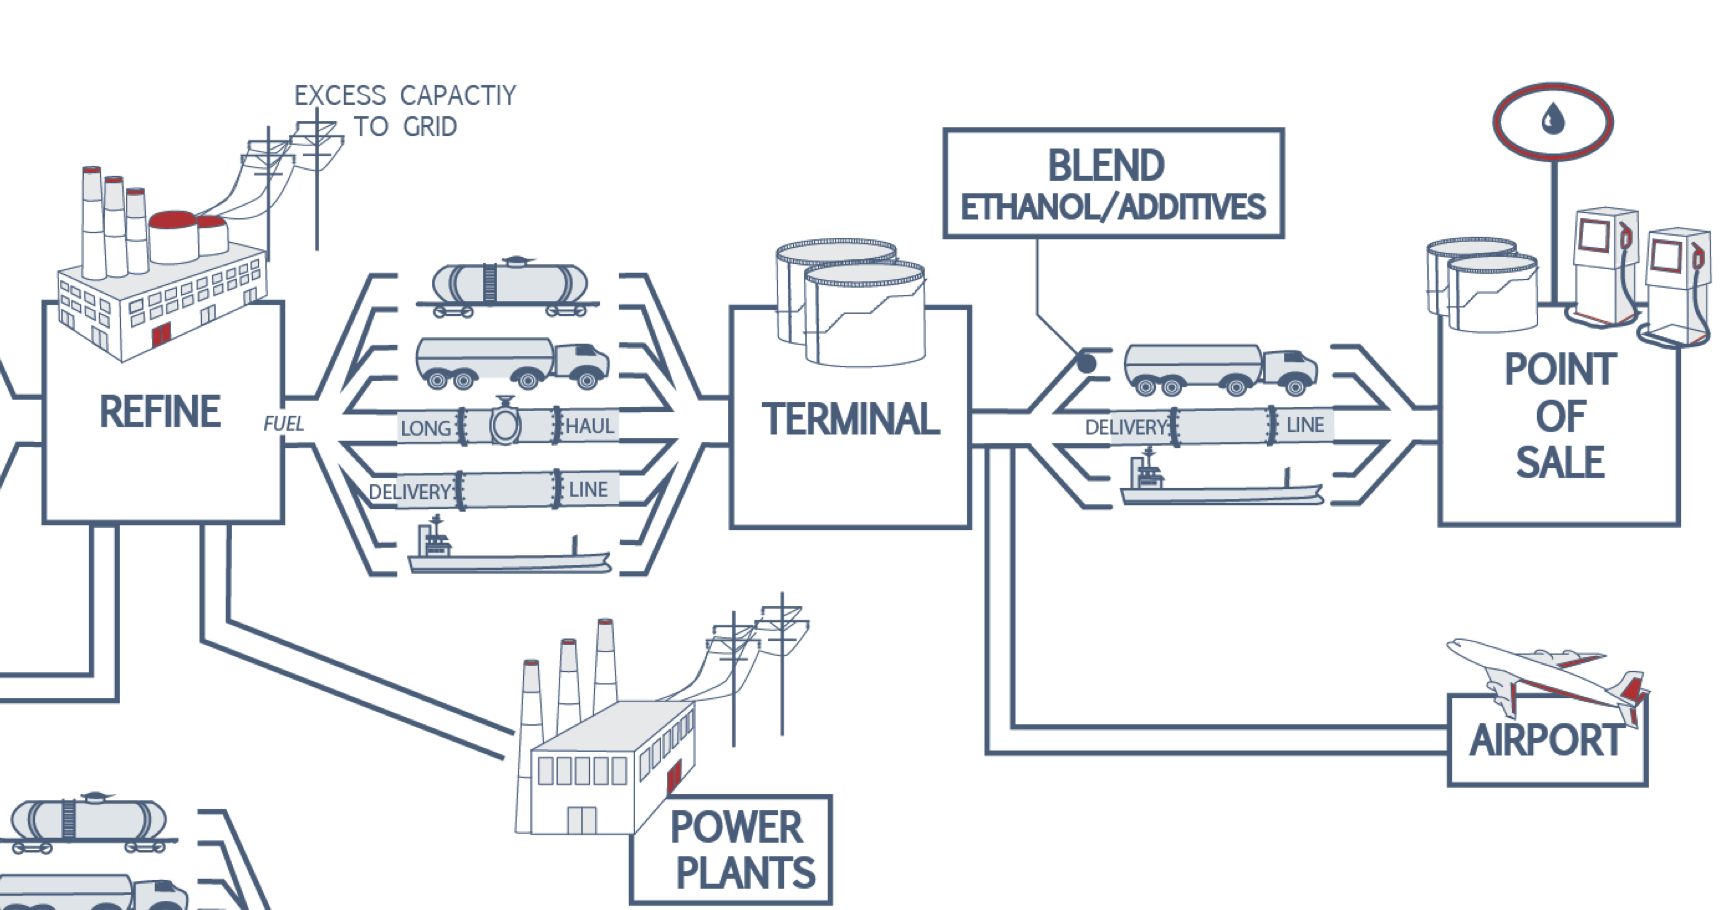
Refineries work 24-7, so their workload needs to be kept fairly constant, but consumption of gasoline has some seasonal variation (usually, people drive more in the summer), so the system has some storage built in.
According to EIA, total U.S. storage capacity for motor gasoline at refineries and bulk terminals is around 375 million barrels, and as of March 31 (just as coronavirus was starting), they were already using close to 60 percent of that storage. This utilization rate undoubtedly increased as consumer demand dropped faster than refineries could slow production.
Last week, refineries produced, or wholesalers blended, around 64 million barrels. So there’s just not that much excess storage capacity in the system to allow production to get too far ahead of demand.
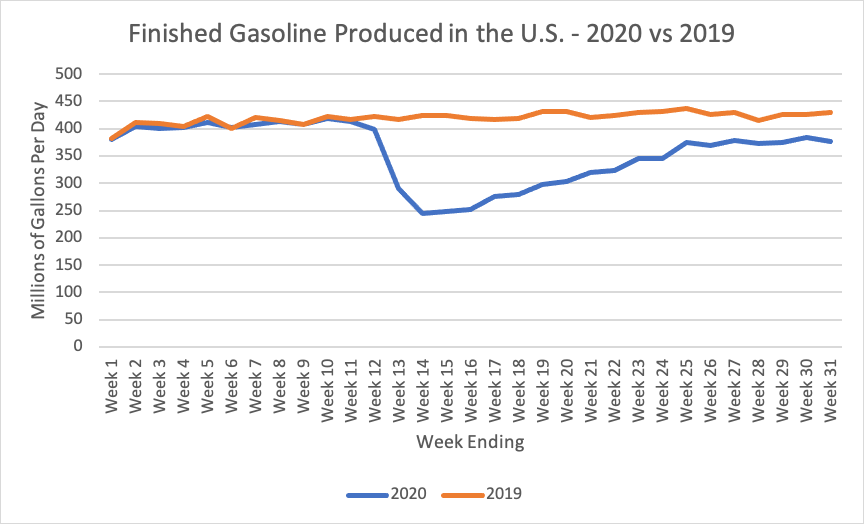
The following chart compares the weekly 2019 production with weekly 2020 production.
At this point, ETW readers are wondering, “what does this mean for the Highway Trust Fund and for state gasoline tax receipts?” As we have explained before, there is a lag time between the moment when consumers stop buying at the pump and the time when the Treasury collects estimated fuel tax payments. First, as noted above, consumer decisions have to trickle upstream to refiners and blenders (where the tax is paid), then there is a lag time of several more weeks for producers to pay tax on the fuel removed from the refinery or terminal, and then money from those estimated tax payments is transferred from the Treasury general fund to the Highway Trust Fund twice a month.
As a result, the changes in consumer demand for gasoline that started in March and were reflected in reduced gasoline production in April (when production was down about 40 percent from 2019 levels) wasn’t fully reflected in Highway Trust Fund tax receipts until May and June.
Highway Trust Fund tax receipts for July should be announced by Treasury later this week and, hopefully, will reflect the rebound of gasoline production that started in May.
In terms of monthly percentages, the vicissitudes of the calendar make it impossible to convert weeks to months precisely on a year-to-year basis. But February 28 was a Friday so we do have a good starting point for weekly comparisons. The following table shows U.S. production of finished motor gasoline for the five four-week periods beginning after February 28, plus the last two-week period that ended July 31.
| U.S. Gasoline Production (Million Gallons) | ||||
| Four-week periods beginning after Feb. 28, 2020 | ||||
| 2020 | 2019 | Decrease | Pct | |
| 1st period | 1,522 | 1,679 | -157 | -9% |
| 2nd period | 1,020 | 1,685 | -664 | -39% |
| 3rd period | 1,200 | 1,703 | -503 | -30% |
| 4th period | 1,390 | 1,724 | -334 | -19% |
| 5th period | 1,497 | 1,697 | -200 | -12% |
| Last 2 weeks | 761 | 855 | -94 | -11% |
These four-week periods won’t track precisely with months. (And EIA does not report highway diesel fuel production, because it is mixed in with all other potential uses of that type of fuel oil, and the Trust Fund also gets money from truck and trailer and tire sales and the annual heavy truck use sticker.)
But gasoline is still the mainstay of surface transportation taxes, and the above numbers show two horrible months and one medium-horrible month. But they also show three months – including the last two months – where production of gasoline, and eventual receipt of taxes on gasoline, was down around the 10 percent level, which is bad, but should be manageable.

