Trends in Per Capita VMT
June 7, 2019
A few weeks ago, I decided to divide the state-by-state estimates of the number of gallons of gasoline used on highways by the Census Bureau’s annual state population estimates to see if any interest trends could be identified (see article here). But gasoline use is a complicated measure that not only reflects driving patterns but also the relative fuel efficiency of various vehicles. Perhaps it’s easier to single out driving.
Using the annual vehicle miles traveled (VMT) reporting by state in Table VM-2 of the Highway Statistics series, divided by the same Census Bureau annual July 1 population estimates for each year used in the last article, a few interesting patterns arise. First, the overall U.S. per capita VMT totals:
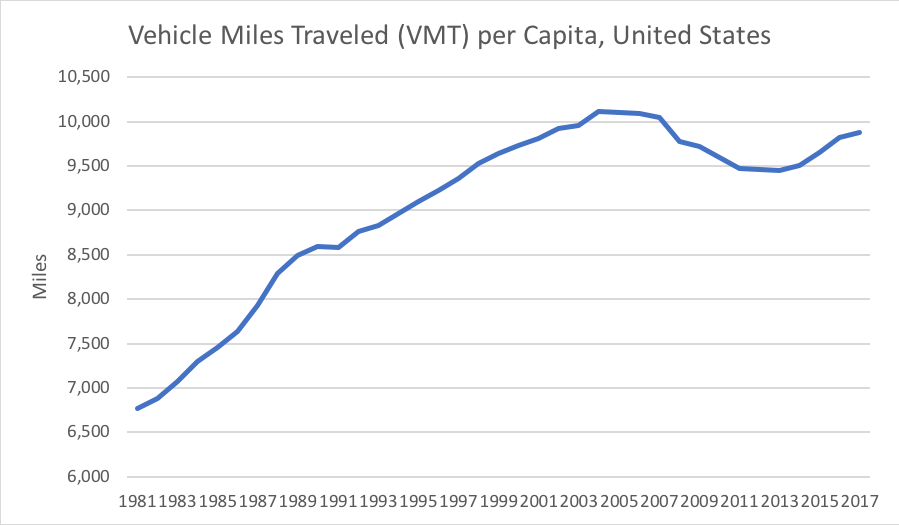
In 1981, total U.S. VMT was 6,767 miles per U.S. resident. This includes not only personal driving but all truck and bus traffic as well. 18.5 miles per day, 365 days per year. This grew consistently (with one exception of a flat-line in 1991) until 2004, averaging 1.8 percent per year growth over that period. This was not just a growth in personal driving but was also spurred somewhat by the trucking deregulation enacted in 1980.
In 2004, VMT per capita peaked at 10,117. The following year, the post-Katrina oil shock spurred a reversal of the trend, and that downward slide was amplified by the 2008-2011 recession. Per capita VMT decreased every single year. By 2013, per capita VMT was down to 9,455. But starting in 2014, the trend reversed itself again, and per capita VMT grew by an average of 1.1 percent per year over the last four years, to 9,880 in 2017.
I isolated four states that were all around the national per capita VMT average in 1981 if they have trended towards, or away from, the national average. California, Missouri, Mississippi, and Oregon.
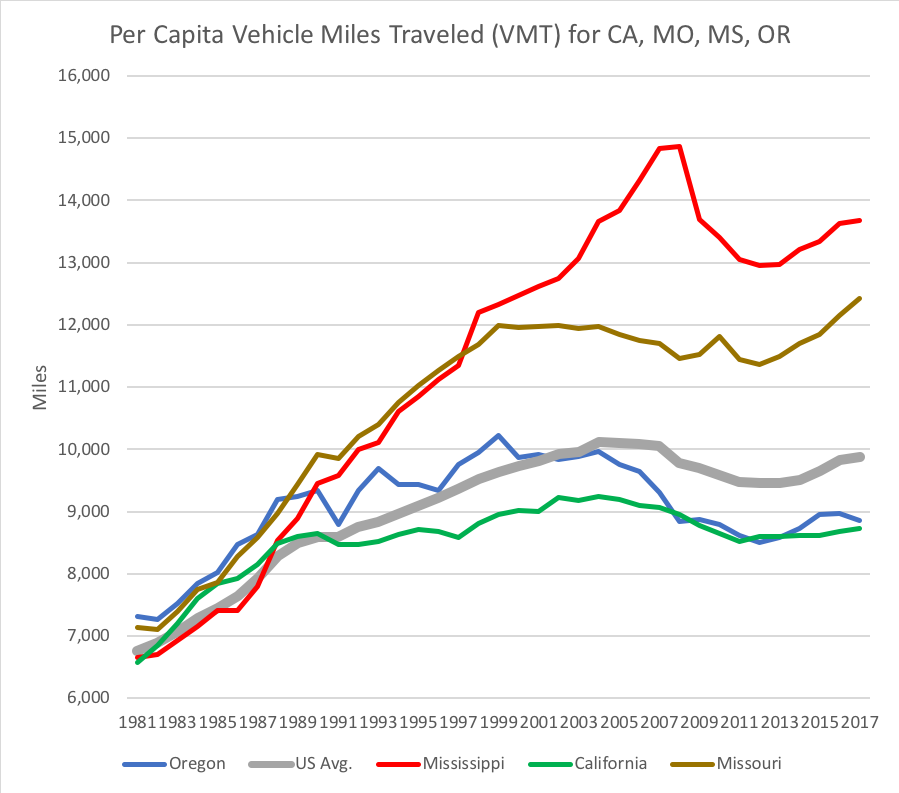
California and Oregon (the former starting in the 1980s, the latter in the late 1990s) have managed to push their per capita VMT averages below the national average, while Missouri and especially Mississippi have pushed their per capita VMT far, far above the national average.
I also looked for states that started out the timeframe well above or below the national per capita VMT average and have since gone to the other side of the line. In particular, since this whole exercise started in a conversation about Texas, I looked at the Lone Star State, and also Louisiana, Washington State, and West Virginia.
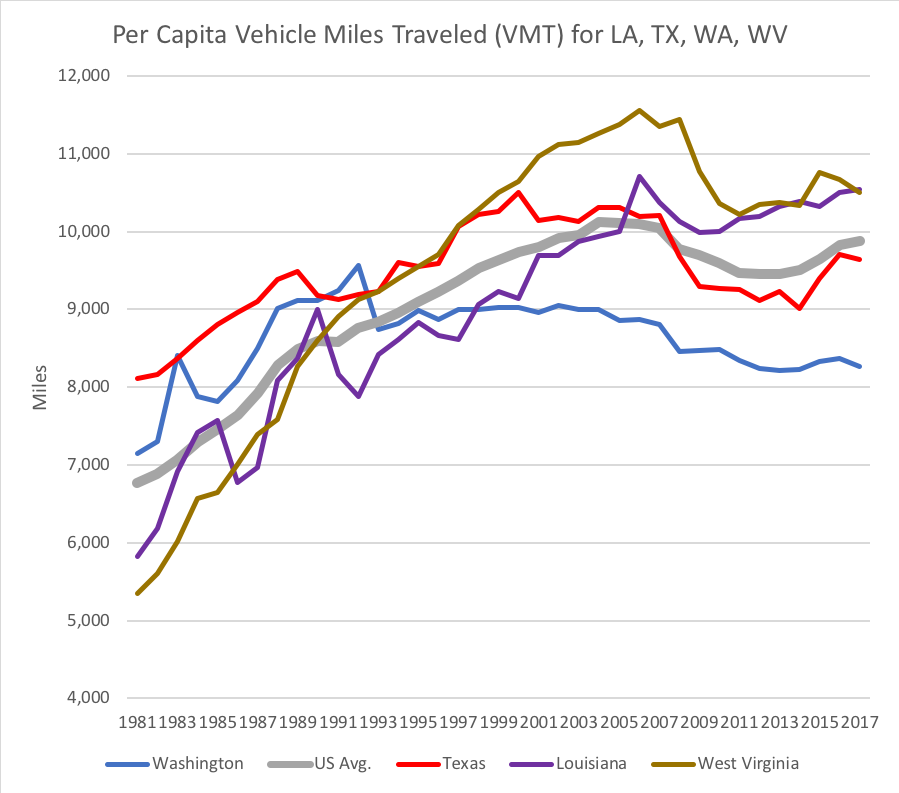
Texans have apparently been able to modify their per capita driving in the 21st Century to where their per capita VMT is now slightly below the national average. (Bear in mind that Texas has a higher than average share of truck traffic because of NAFTA and roadway extent, so the individual driving side should presumably be even lower than the national average.) This may have something to do with Texas being a young state – the median age of a Texan is the fourth-lowest in the U.S. (after Utah, Alaska and the District of Columbia), and a lower average age means more families with children who are too young to have a drivers license. The age issue may also have something to do with West Virginia’s trend towards higher per capita VMT (they are the fourth oldest state).
The same caveats apply to this data as in the previous article – there is a lot of noise in the data for low-population, high-area states, where minute fluctuations in the annual Census numbers make an outside difference in the per capita totals. But here are the ten highest per capita VMT states in 1981 and in 2017, and the ten lowest per capita VMT states in the same years.
| Ten Highest Per Capita VMT | Ten Highest Per Capita VMT | |||
| …in 1981… | …in 2017… | |||
| Wyoming | 10,614 | Wyoming | 16,901 | |
| Oklahoma | 9,296 | Alabama | 14,498 | |
| Montana | 8,808 | New Mexico | 14,178 | |
| South Dakota | 8,777 | Mississippi | 13,673 | |
| New Mexico | 8,605 | North Dakota | 12,867 | |
| North Dakota | 8,109 | Oklahoma | 12,562 | |
| Texas | 8,105 | Missouri | 12,427 | |
| Georgia | 8,054 | Indiana | 12,275 | |
| Colorado | 7,727 | Tennessee | 12,261 | |
| Nevada | 7,683 | Arkansas | 12,118 | |
| Ten Lowest Per Capita VMT | Ten Lowest Per Capita VMT | |||
| …in 1981… | …in 2017… | |||
| Massachusetts | 6,231 | California | 8,728 | |
| Connecticut | 6,189 | New Jersey | 8,720 | |
| Pennsylvania | 6,030 | Illinois | 8,447 | |
| Hawaii | 5,987 | Washington | 8,272 | |
| Rhode Island | 5,850 | Pennsylvania | 7,945 | |
| Louisiana | 5,828 | Rhode Island | 7,573 | |
| Illinois | 5,753 | Hawaii | 7,547 | |
| West Virginia | 5,343 | Alaska | 7,460 | |
| Dist. of Col. | 5,193 | New York | 6,316 | |
| New York | 4,504 | Dist. of Col. | 5,341 | |
The full state-by-state data can be downloaded in a five-page PDF file here.

