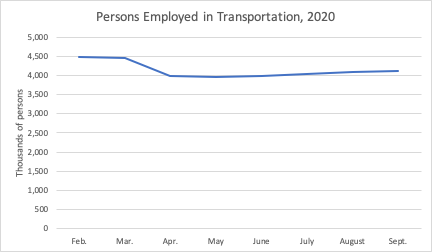
The Labor Department released the monthly jobs report for September 2020 this morning, showing that the economy created another 41,400 jobs in the transportation sector in September. But that total is still down about 350,000 from the February 2020 pre-coronavirus level. Meanwhile, jobs in heavy and civil engineering construction dropped by about 3,400 in September (seasonally adjusted), putting that field down by about 93,000 persons since the onset of coronavirus.
For transportation overall, gains since the sector bottomed out in April have been incremental, at best.
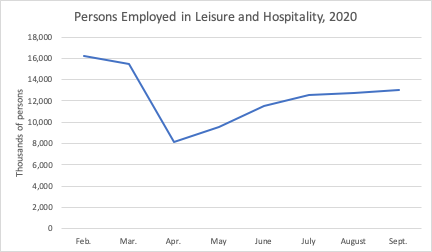
However, to put things in perspective, the jobs lost in transportation, at the nadir, were far less than the job losses in other sectors, like leisure and hospitality:
Looking at specific types of transportation, about 21,400 jobs in transit and ground passenger transportation were added back in September, and 10,300 courier and messenger jobs were also created. (Courier and messenger is the only transportation sector that has grown during COVID.)
About 1,600 air transportation jobs were lost in September, but that pales compared to the 30,000 to 40,000 that are expected in October, now that the no-layoffs provision of the CARES Act has expired.
| Excerpts from the BLS Monthly Employment Situation Report for August 2020 (Seasonally Adjusted Numbers) |
|
|
Thousand people employed in each month |
Change (thousand) |
Change (percent) |
|
|
Feb. |
July |
August |
Sept. |
Aug.-Sep. |
Feb.-Sep. |
Aug.-Sep. |
Feb.-Sep. |
| Construction |
|
|
|
|
|
|
|
|
|
Heavy and civil engineering |
1,098.9 |
1,014.9 |
1,009.1 |
1,005.7 |
-3.4 |
-93.2 |
-0.3% |
-8.5% |
|
|
|
|
|
|
|
|
|
|
| Manufacturing |
|
|
|
|
|
|
|
|
|
Transportation equipment |
1,742.9 |
1,607.5 |
1,609.8 |
1,625.1 |
15.3 |
-117.8 |
1.0% |
-6.8% |
|
|
|
|
|
|
|
|
|
|
| Trade, transportation and utilities |
|
|
|
|
|
|
|
|
|
Air transportation |
511.2 |
395.4 |
405.9 |
404.3 |
-1.6 |
-106.9 |
-0.4% |
-20.9% |
|
Rail transportation |
159.9 |
145.3 |
145.8 |
145.9 |
0.1 |
-14.0 |
0.1% |
-8.8% |
|
Water transportation |
64.9 |
55.0 |
54.9 |
56.1 |
1.2 |
-8.8 |
2.2% |
-13.6% |
|
Truck transportation |
1,527.3 |
1,439.8 |
1,449.8 |
1,454.4 |
4.6 |
-72.9 |
0.3% |
-4.8% |
|
Transit and ground passenger transportation |
508.2 |
335.0 |
346.2 |
367.6 |
21.4 |
-140.6 |
6.2% |
-27.7% |
|
Pipeline transportation |
50.5 |
50.0 |
49.8 |
49.5 |
-0.3 |
-1.0 |
-0.6% |
-2.0% |
|
Scenic and sightseeing transportation |
36.7 |
20.7 |
20.9 |
21.7 |
0.8 |
-15.0 |
3.8% |
-40.9% |
|
Support activities for transportation |
763.8 |
672.3 |
679.0 |
683.9 |
4.9 |
-79.9 |
0.7% |
-10.5% |
|
Couriers and messengers |
847.8 |
917.8 |
926.3 |
936.6 |
10.3 |
88.8 |
1.1% |
10.5% |
|
|
|
|
|
|
|
|
|
|
| Other sectors/industries of note |
|
|
|
|
|
|
|
|
|
Food services and drinking places |
12,303.1 |
9,680.5 |
9,784.8 |
9,985.1 |
200.3 |
-2,318.0 |
2.0% |
-18.8% |
|
Amusements, gambling, and recreation |
1,785.5 |
1,205.2 |
1,209.3 |
1,278.1 |
68.8 |
-507.4 |
5.7% |
-28.4% |
|
Accommodation |
2,091.0 |
1,298.1 |
1,314.9 |
1,365.6 |
50.7 |
-725.4 |
3.9% |
-34.7% |
|
Local government, education |
8,042.0 |
7,549.2 |
7,687.8 |
7,456.7 |
-231.1 |
-585.3 |
-3.0% |
-7.3% |
|
Local government, excluding education |
6,636.8 |
6,127.1 |
6,186.4 |
6,282.8 |
96.4 |
-354.0 |
1.6% |
-5.3% |

