Since the COVID pandemic began, transit agencies have been trying to figure out when all their riders will come back. Although local bus ridership is bouncing back from post-pandemic lows, it is still no more than 70 percent of pre-COVID levels at many transit agencies, including LA Metro in Los Angeles and NJ Transit in New Jersey.
On many rail lines, the ridership increase has been just a short bounce — more of a leap into a net rather than a trampoline. That is because, compared to bus riders, rail passengers are more likely to be white-collar workers with greater flexibility to work from home.
Ridership is approximately 40 percent of pre-COVID levels on Chicago’s commuter rail lines and 50 percent on LA Metro. While New York’s subways are now carrying almost 3.5 million trips on a typical weekday, that is far below the 2019 average of 5.5 million. Rail ridership has dropped even more in San Francisco because technology firms have adopted generous remote work policies and a substantial population loss occurred after the pandemic began.
Based on reported and extrapolated data, the American Public Transit Administration created the line graph below, to show weekly transit ridership levels in the U.S. over the past two and a half years.
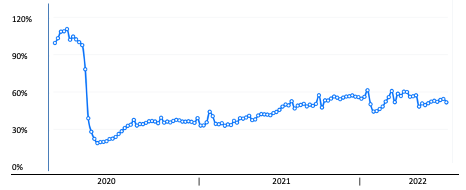
This data is generated by Transit for APTA as part of our Ridership Tends dashboard at transitapp.com/APTA
Transit ridership has fallen less on weekends than weekdays because trips to recreation and shopping destinations (as well as trips to service industry jobs) have been more stable than weekday office trips. Many agencies, including BART, have seen the steepest drop-offs on Mondays and Fridays. And other transit operators, including New York’s Metropolitan Transportation Authority (MTA), are finding that ridership falls more sharply than it did pre-pandemic, when there is inclement weather. After all, who wants to go into the office on a rainy Monday morning?
Forecasting
Transit agencies forecast ridership to make more informed decisions about every aspect of their operations, from staffing levels to service frequency. Forecasts are also used to identify funding needs and help prioritize long-term investments such as whether to add a new bus route, construct a rail line, or build another bus depot.
Forecasting the number of times that office workers will use transit to and from work is getting special attention now because those numbers have been the most unpredictable. There are other reasons why these forecasts are so important. Work trips have been transit agencies’ bread-and-butter, and they also determine how other trips are made (such as day-time errands). Work trips also relate to leisure trips. For example, today marks the beginning of the July 4 weekend; the “after work” train from New York’s Penn Station to Long Island’s beaches will undoubtedly carry far fewer riders than it did a few years ago, since more people have flexibility over where they can work.
Transportation agencies have been using a wide range of sources to monitor and forecast work trips. The Port Authority of New York and New Jersey (which operates the PATH trains) has been monitoring data about national office occupancy based on entry-card swipes at office buildings. Duncan Kisia, the Authority’s deputy director of planning and chief economist, says these swipes are a good barometer of how many people are going back to work. The most recent data shows office occupancy rates ranging from 35 percent in San Francisco to more than 55 percent in Austin and Houston.
In the very early stages of COVID, Kisia noted, ridership was expected to materially recover once the pandemic was under control, presumably as vaccines and herd immunity enabled a return to in-person activities. “The Delta surge and the subsequent Omicron wave confounded a lot of assumptions about how many workers would be back in offices by now,” he said.
 |
April 2020 in Portland at the beginning of the pandemic.
|
The Port Authority’s near-term outlook had been informed by surveys of New York City employers conducted by the Partnership for New York City, a civic organization led by business leaders. However, the employers captured in these periodic surveys consistently overestimated when and how many workers would be back at work. “The sticky nature of remote work may be seeping more and more into the mindset of employers and decision-makers, as the most recent employer survey outlook shows a much more tempered outlook,” Kisia said.
Dennis Lee and his team at BART are also watching employers’ plans closely. The Bay Area Council, another civic organization led by business leaders, has similarly been surveying a broad range of employers about their expectations regarding the return to the office. The council now expects the average worker will go to the office three days a week in 2024 compared to two and a half days in recent months. “That’s the new normal,” Lee says.
NJ Transit has engaged a consultant to build a new model for predicting travel use in its three-state service area. The model forecasts ridership by incorporating a number of variables, including the number of recent COVID cases, how many people are expected to work from home, the likelihood of using transit, and business and socioeconomic data at the census tract level.
Given the recent upward trend of ridership, Matt Safer, NJ Transit’s senior director of demand forecasting and research, expects that ridership in 2025 will be between 75 and 85 percent of the levels that had been expected before the pandemic. Midweek rail ridership will be at the lower end of that range. Based on the data available, NJ Transit’s planners expect rail ridership will not return to 2019 levels until the early 2030s.
Every planner understands the uncertainty of their work. “The problem isn’t that we don’t have a crystal ball,” Safer explained, “it’s that we have many crystal balls and they tell us different things.” As Janno Lieber, the chairman of New York’s MTA, said last year, “Anybody who tells you they know exactly where this is headed is either a dope or they’re lying,”
The Chicago Metropolitan Agency for Planning (CMAP) is conducting a Mobility Recovery study that assesses COVID-related changes to jobs, housing, and transportation patterns. The agency is using information about the types of businesses and jobs across the Chicago region to determine how working from home will change travel behavior. The study is assigning “telework propensity scores” to businesses based upon the likelihood of employees working from home. These scores are based in part on research published by the National Bureau for Economic Research, including the papers “Why Working from Home Will Stick” and “How Many Jobs Can be Done at Home?”
Before the pandemic, the number of employed people working from home was about 8 percent in the New York region, according to Kisia, of the Port Authority. In the future, he expects between 15 and 25 percent of employed people in the region will be working from home on a given day. “Employers appear to be loosening up and allowing employees to work from home,” he said. “I wouldn’t be surprised if it stayed at 25 percent.”
In the wake of rapidly evolving assumptions, it is difficult for the Port Authority to say when PATH system ridership will return to pre-pandemic levels, but Kisia predicted the year 2040 “would be too pessimistic.” He noted, “Many forecasters had estimated too conservative a trajectory for air travel recovery that mirrored transit’s experience earlier on, but has since far exceeded initial expectations. For transit, there may also be a tendency to extrapolate current experience and conditions too far into the future.”
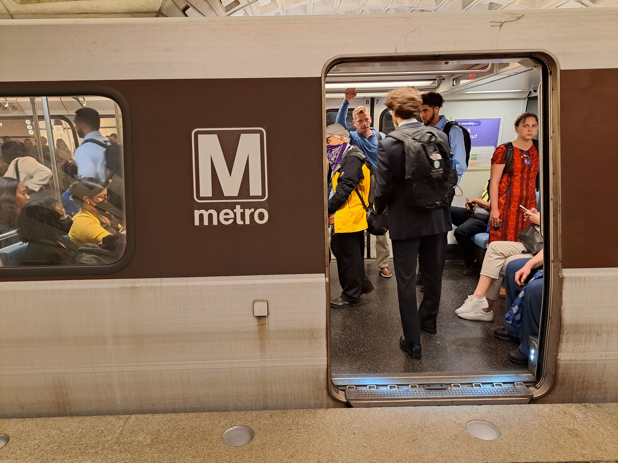
 |
Rush hour this summer at a station in New Jersey |
The MTA uses a variety of public and private resources to monitor and estimate travel patterns in New York. Michael Shiffer, MTA’s senior vice president for regional planning, says, “a modern transit agency can’t rely on a single source of information, especially in such transformational times.” The MTA has retained a consulting firm for short-term financial forecasts and is also evaluating data from employer surveys and companies that track office-building access. They also have access to big data sources; companies have sprung up that aggregate anonymized travel-related data that comes from cell phones, cars, credit cards, and other sources.
Like other agencies, the MTA is looking closely at when and how often workers are expected to return to the office. Since its weekday ridership is so heavily influenced by Manhattan’s office occupancy, MTA’s planners are working with city officials to figure out what might happen in the real estate industry. Manhattan alone has more than 450 million square feet of office, or nearly 11 percent of all office space in the nation. The planners are trying to answer pivotal questions: will businesses downsize their space? Can they even do so, given their lease agreements? If firms do downsize, will new ones move in, and will those buildings be just as bustling as they once were?
Dennis Lee and his team at BART expect persistent long-term impacts from remote work. Right now, they are looking at three different scenarios: where future ridership is 60 percent, 70 percent, or 80 percent of the estimates forecasted before COVID. The 70 percent assumption assumes that people will work, on average, approximately two and a half days per week, and that the number of non-work trips will be close to pre-pandemic levels.
Given these scenarios, BART’s planners expect ridership will probably not return to 2019 levels until the middle of the next decade, or sometime after 2035. However, it will still be far below earlier estimates because by the mid 2030s, BART will have added six more stations since the pandemic began.
Challenges
Transit officials understand the challenges they are facing. “People don’t really want to go to work,” said Joseph Forgiarini, a senior director. “If they do, they are not convinced that they want to ride public transit.”
He expects LA Metro ridership may be back to normal on buses by 2024, if recent trends continue. However, a shortage of bus operators may imperil LA Metro’s ability to provide planned service levels. On the rail side, Forgiarini says “I’m not comfortable that we’ll ever get back to pre-Covid ridership levels. That dynamic is playing at our own Metro headquarters, where many employees are working from home between one and three days per week. The story is still being written when rail ridership will come back.”
 |
Rush hour this summer at a station in Washington, D.C. |
Perceptions about public safety are a serious challenge to increasing ridership. For instance, LA Metro’s managers are keenly aware of customer complaints about the rising number of homeless individuals on its trains and stations, but the agency is facing powerful socioeconomic forces that impede its progress. Not only are there more unhoused people, but they are more noticeable because of the decline in ridership.
For transit operators, an even bigger challenge will be to keep providing the same level of transit services. Thanks to the federal Coronavirus Aid, Relief, and Economic Security (CARES) Act, the Federal Transit Administration is providing $25 billion across the U.S. to support operating and capital transit expenses. That has allowed transit agencies to freeze fares and continue operating their pre-pandemic service levels.
Due to disappointing revenues, however, transit agencies across the country are facing what has been described as a fiscal cliff. For example, the Massachusetts Bay Transportation Authority in Boston is looking at a potential half-billion-dollar operating budget deficit by 2024 as its COVID relief funding runs out. In the nation’s capital, Washington Metropolitan Area Transit Authority faces a funding gap of more than $500 million in its 2024 fiscal year.
BART’s Dennis Lee notes that rail systems do not have as much flexibility to cut expenses as bus lines. “Cutting service just doesn’t significantly reduce costs because we still have the same number of station agents, track maintenance workers, and cleaners.” He noted that when a transit agency cuts rail service by 20 percent, expenses are reduced by a much smaller amount. The calculus is different for bus systems because they do not have to maintain their own right-of-way.
Given the uncertainty in forecasting, most regional travel demand models have not been updated to reflect new travel behavior patterns. The output of these models, which simulate highway and transit trips across a metropolitan area, often determine whether major transit expansion projects will receive funding. Given rapidly shifting travel patterns, transportation agencies are leery about conducting the types of surveys needed to inform the models. For example, CMAP conducts a survey in Illinois approximately every 10 years when more than 12,000 households track the trips they make for work, school, shopping, errands, and socializing.
Uncertainty
Two lessons are clear when talking to planners across the country. First, forecasters need to obtain data from a wide range of sources. City planning departments, metropolitan planning organizations, employers, civic groups, real estate developers, and many others can provide valuable information. Second, transit agencies should conduct their forecasts in a transparent way that others can both understand and learn from them.
Dennis Lee noted transit agencies have always been under pressure to make correct forecasts, and “in retrospect, estimating ridership was relatively easy.” But since the pandemic began, he remarked tongue-in-cheek, “there is less pressure because no matter what, we’ll be wrong.”
Kisia, the Port Authority’s chief economist, noted that “Forecasting is now more challenging because of so much uncertainty. We had stable relationships between economic indicators and travel demand but some of those relationships have changed and there is too little information at this point to gauge how much they have changed. We’re not sure to what extent, what we are seeing, are transitory impacts.”
He asked rhetorically “When does the new normal start? Are we in it?

