How much buying power has the federal gasoline tax lost over the years, and how have consumers felt past gasoline taxes in their daily lives?
I have seen several different analyses from well-meaning organizations (like this one here) that purport to describe the lost buying power of the gasoline tax due to inflation as measured by the Consumer Price Index. This is fundamentally inaccurate. CPI is a measure of household consumer buying power and is an excellent measure of how costs are perceived by the average household – there is a reason that it is colloquially called a “cost of living” index. (Just see the full breakdown of the “basket of goods” from the October 2019 report – 13.2 percent of the index is food costs, 33.5 percent is rent or mortgage payments, 7.1 percent is health care, 3.1 percent is clothing, 1.6 percent is alcohol and tobacco, etc. etc.)
That’s not what the Highway Trust Fund grants supported by motor fuel taxes buy. Those taxes buy cement, asphalt, aggregate, land, structural steel, heavy equipment, unionized or prevailing-wage labor, and engineering services. CPI doesn’t tell you squat about those costs and thus is a fundamentally inaccurate measure of the buying power of the motor fuel taxes deposited in the Highway Trust Fund.
For the buying power of those taxes we have to look elsewhere. I decided to use the same adjustment that the Congressional Budget Office used in its excellent report on total public infrastructure spending – the Bureau of Economic Analysis price index for state spending on highways and streets (since that is where most Highway Trust Fund spending shows up in the economy, as pass-through dollars to state DOTs). (The index is in NIPA Table 5.9.4, line 40.)
The following chart shows two lines: how federal gasoline taxes since 1957 have been felt by consumers (relative to CPI, the cost of living) and how much buying power federal gasoline taxes deposited in the Highway Trust Fund have had since 1957, measured by the BEA highways/streets price index. (This means there are intentional discrepancies in the nominal tax rate in the 1990s, since 2.5 cents per gallon of the 5.0 cent 1990 increase was devoted to general fund deficit reduction from FY 1991-1995 and since the entirety of the 4.3 cent 1993 tax increase was devoted to general fund deficit reduction from FY 1994-1997. The “felt by motorists” line shows the entirety of the gas tax – GF and HTF – while the buying power line only shows the amounts deposited in the Trust Fund that actually went towards building highways and transit. We are also ignoring the 0.1 cent per gallon environmental tax that appears and disappears since 1982.)
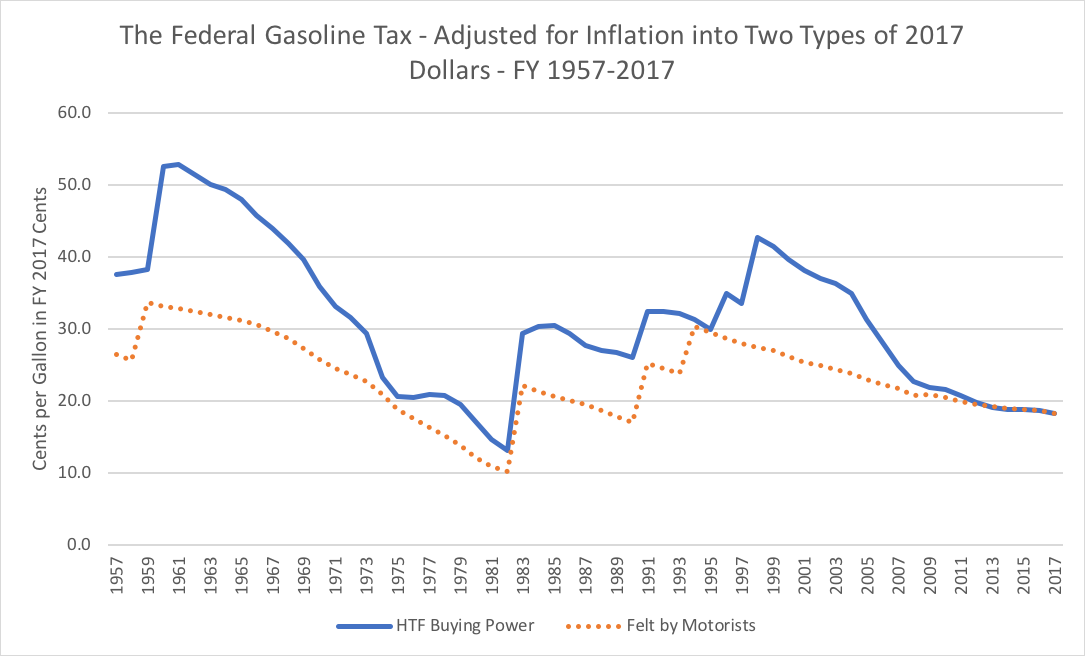
In terms of buying power, the peak came just after President Eisenhower successfully forced Congress to increase the tax from 3 cents to 4 cents per gallon in fall 1959 to avert Highway Trust Fund insolvency (see story here). The FY 1961 gas tax of 4 cents per gallon had an equivalent buying power to 52.8 cents per gallon in 2017 dollars. That buying power is what built the bulk of the Interstate Highway System.
But, to rebut the ahistorical people who always want to say that any current situation is “unprecedented” or the “worst ever” because they are too lazy do a little research, the buying power situation has indeed been worse than it is today. Because of the Great Inflation of the 1970s, the buying power of that nominal 4 cents per gallon to build streets (and, increasingly, transit systems) had dropped down to 13.2 cents per gallon in the 2017 buying power equivalent in 1982 before Congress and President Reagan more than doubled the tax to 9 cents per gallon the following year.
In terms of more recent history, when the both the 1990 and 1993 tax increases were first fully deposited in the Trust Fund, in FY 1998, bringing the nominal gas tax for the Trust Fund to its current 18.3 cent per gallon, that had the buying power equivalent of 42.8 cents per gallon in 2017 cents. By that measure, the gas tax has lost 57 percent of its buying power since that 1998 peak.
In terms of relative burden on motorists (compared to CPI), the nominal 4 cent per gallon tax in FY 1959 felt like the 2017 equivalent of 33.2 cents per gallon. The more recent peak, in FY 1994, was the 2017 equivalent of 30.3 cents per gallon.
(Interestingly, immediately before the establishment of the Highway Trust Fund, the federal gas tax was 2 cents per gallon and was deposited in the general fund. At that time it was not formally linked to highway spending, but there was discussion in Congressional debate of how gas tax receipts more or less covered existing highway program spending, pre-Interstate. In FY 1956, that 2 cent per gallon was felt by consumers as the equivalent of 18.1 cents per gallon in 2017 dollars – almost exactly the nominal 18.3 cent per gallon current rate.)

