Texas Reignites Donor State Debate
April 5, 2019
Texas tried to revive the old “donor state vs. donee state” highway funding debate last week. In a March 26 letter to Congressional leaders from the Texas delegation, plus an accompanying white paper prepared by TxDOT, the legislators complained that “Texas only receives 95 cents back for every dollar it sent to Washington in federal fuel taxes” and asked for a “fair, equitable and logical approach” to highway funding distribution formulas in the next surface transportation reauthorization bill.
It has been over a decade since the “donor state versus donee state” issue was front and center, so it’s worth reviewing the topic for those who have come along since then. In order to understand the dispute (which now dates back about 30 years), you have to understand both the tax side and the spending side of the equation.
Taxes. A few points on how state-by-state tax payment data is calculated by the Federal Highway Administration.
- The federal government does not know precisely where gasoline is purchased by motorists – the tax is collected when the fuel is removed from “the rack” (the bulk storage terminal, a.k.a. the tank farm). Sometimes the fuel crosses state lines before it gets to the service station where it is sold. And there is no guarantee that the fuel purchased in a state is used in that state. (Ed. Note: I used to work for the Congressman who represented Bristol, Tennessee, which is on the south side of State Street from Bristol, Virginia – people every day cross state lines to buy gas then go back home.) But one can assume that most gasoline is used in-state, so FHWA uses modeling with state VMT data to assign gasoline tax payments to states.
- The federal government really does not know where diesel fuel is used versus where it is purchased, since most diesel is used by the trucking industry and so much trucking is interstate. So the modeling for diesel fuel is much more VMT-intensive based on estimated trucking miles, which in turn rely a lot on how many Interstate and other high-traffic NHS miles a state has.
- The federal government has no earthly idea where truck and tire sales taxes and heavy use truck taxes are used versus where they are paid. (When UPS buys trucks, does the state in which that purchase is registered have any relationship to the state where’re that truck is used the most?) So FHWA just assigns each state a share of those revenues equal to the state’s share of diesel fuel revenues.
A state’s estimated share of gasoline tax payments can be vastly different from its estimated share of trucking industry tax payments. The big square states that have long Interstates but low populations stand out. The last numbers are from FY 2016 (FHWA Table FE-9) – Wyoming had 0.24 percent of estimated gas tax payments but 0.86 percent of estimated diesel and trucking tax payments. It share of diesel and trucking tax payments was 3.6 times higher than its share of gasoline tax payments. On the other end of the spectrum, Hawaii had 0.33 percent of estimated gas tax payments but, being bereft of interstate trucking, had just 0.13 percent of diesel and trucking taxes (its share of gas tax payments was 2.5 times higher than its share of diesel/trucking tax payments).
This is why Texas stands out on the revenue side – it not only has a high population which has a strong pro-driving culture and has little access to mass transit, but it also has a lot of long Interstates (and all that NAFTA truck traffic). In 2016, FHWA estimates that Texas paid 10.01 percent of total gasoline taxes and 12.87 percent of total diesel and trucking industry taxes as well.
Spending. The Highway Trust Fund was created in 1956 as a way to pay for construction of the Interstate system as well as the rest of the ongoing federal-aid highway program.
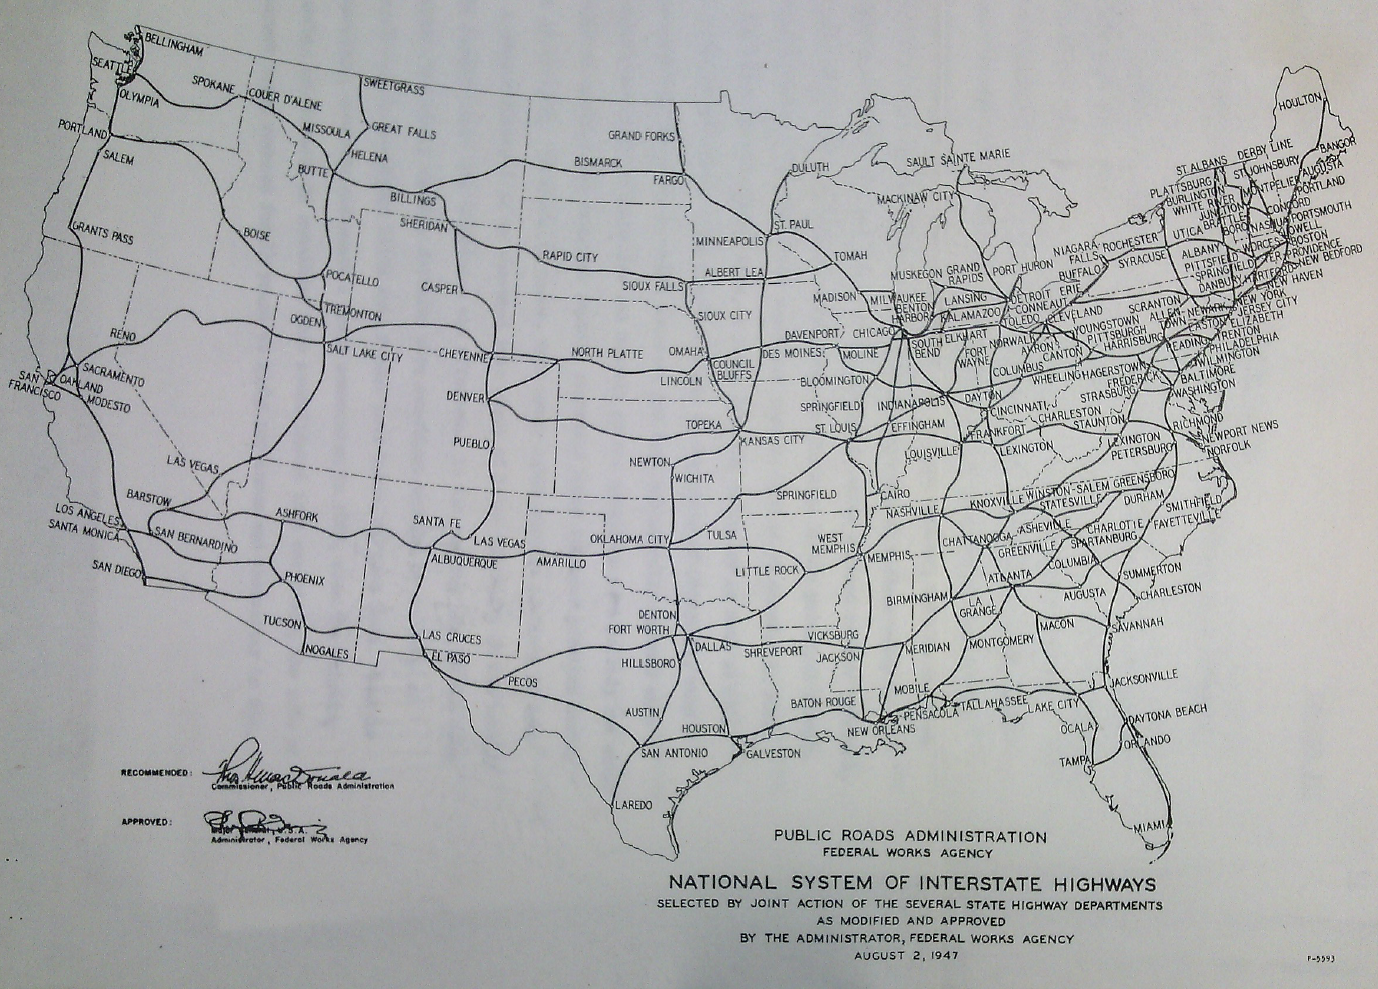
The regular highway program at the time apportioned money to states via a formula established in 1916 (1/3 state population, 1/3 state square mileage of land, 1/3 state federal-aid road miles). But the Interstate system was funded on a “cost to complete” basis – the 48 states and the U.S. Bureau of Public Roads had negotiated a specific map of proposed Interstates, and each state was going to get as much money as it took to build the roads on that map within their state boundaries. A look at the map that was negotiated by the states and BPR in 1947 makes clear that states like Montana, Wyoming and the Dakotas could never, ever, ever afford to build those long east-west routes on their own, but without them, you can’t get from one side of the country to the other, which was the whole point of the Interstate. So shared sacrifice, with some donors and some donees, was an explicit part of the Interstate bargain and the 1956 Act. Everyone accepted this.
What happened was that by the 1980s the construction of the Interstate was largely complete, and states started arguing about their “fair share” of their Highway Trust Fund tax payments in a post-Interstate world. Without Interstate construction to hold the states together in common purpose, the highway program became “every state for itself.” Congress started with an 85 percent “minimum allocation” in the 1980s where each state was guaranteed no less than an 85 percent rate of return on their HTF Highway Account tax payments (if your state contributed 2.000 percent of HA taxes, you were entitled to no less than 1.700 percent of highway funding – 85 percent of 2.000 percent). That later got boosted to 90.5 percent, then 92 percent.
(Those calculations have a lag – after the close of a fiscal year on September 30, it takes FHWA several months to work its voodoo and allocate tax payments to states. Those estimates are then used to determine what donor state adjustments need to be used for the coming year. So FY 2017 closed on September 30, 2017, and a few months later, FWHA finished its calculations, so those 2017 tax payments were used to determine the donor state adjustment for the money given to states on October 1, 2o18, which was fiscal year 2019. This is why there are some discrepancies between the dollars and percentages in the Texas letter and TxDOT paper versus the FHWA table which compares 2017 taxes to 2017 funding.)
Powerful “donee” states (Pennsylvania, Rhode Island, West Virginia, Alaska, etc.) responded by guaranteeing that their share of total funding in the post-Interstate world would be the same as it was during earlier decades. This in turn meant that the underlying formulas (based on things like lane-miles, VMT, bridge repair costs, Clean Air Act attainment, etc. – see Appendix D of this document) no longer had any real meaning –money was moved around as necessary to match donee state share guarantees and donor state minimums. All that mattered was a formula that made at least 30 state DOTs happy in order to get 60 votes in the Senate and which also made the VIPs (key committee chairmen and ranking members, and party leaders) happy.
Then, in September 2008, the Highway Trust Fund ran out of money and had to receive the first installment of what have been $140 billion in bailouts from the general fund of the Treasury since then. For a few years, Congress tried to pretend nothing had changed, and kept passing short-term extensions of the 2005-2009 SAFETEA-LU authorization law. When they finally passed a full-fledged reauthorization of the program in 2012 (MAP-21), they cleverly changed the donor state guarantee from a 92 percent of your state share of total tax payments to a guarantee of 95 percent of your actual Highway Account tax dollars. At the time, the staff who wrote MAP-21 did not think that any states would ever actually trigger the 95 percent adjustment, because of the general fund bailouts. But, after this process was extended in the FAST Act, Texas started triggering the adjustment.
(Ed. Note: The Texas delegation letter also revives the percentage share donor state argument, claiming a rate of return of only 80 percent on a share-in, share-out basis, which is abject nonsense in a world where the Trust Fund has received $140 billion in general fund bailouts that were then made completely fungible with highway user excise tax receipts. According to Table 5 in the IRS data book, once excise taxes are removed from the equation, Texas only paid 7.4 percent of total U.S. gross tax receipts in FY 2017, while receiving 9.3 percent of total HTF highway apportionments and allocations. The District of Columbia, meanwhile, paid 0.84 percent of total federal non-excise taxes in 2017 but only received 0.40 percent of the highway funding. Granted, the IRS reporting does not segregate general fund revenues from Social Security Trust Fund revenues. But if Texas is serious about claiming that their share of gasoline and trucking excise taxes entitles them to the same share of general fund revenues, then one can expect people like House Highways and Transit Subcommittee chairwoman Eleanor Holmes Norton (D-DC) to pry that information out of the IRS to make counter-arguments about getting their fair share of general fund tax payments. That debate will get very unproductive very quickly.)
Cumulative totals. FHWA has recently updated Table FE-221 which gives total dollar amounts of estimated Highway Account tax payments, and apportionments and allocations of highway contract authority, for each state both in fiscal 2017 and over the 1957-2017 cumulative period. Over those 61 years, states have received $194.6 billion more in contract authority than they have paid in excise taxes. Texas is the only state still in the red as of the end of 2017, with a total deficit of $984 million. New York State, by contrast, has received $14 billion more in highway funding than it has paid in estimated tax payments to the Highway Account. (And this likely pales in comparison to how much more it has received in Mass Transit Account funding than it has paid in taxes to that Account – the Federal Transit Administration does not make state-by-state funding data easily available, in part because it would show everyone what a lopsided share of transit dollars goes to the Empire State.)
| 51 Years of Cumulative HTF Highway Account Tax Payments vs Highway Funding Received, FY 1957-2007 | |
| 5 Biggest Cash Donee States | |
| New York | +$14.06 billion |
| Alaska | +$12.14 billion |
| Pennsylvania | +$11.49 billion |
| California | +$10.50 billion |
| West Virginia | +$7.51 billion |
| 5 Smallest Cash Donee States | |
| Michigan | +$988 million |
| Maine | +$873 million |
| North Carolina | +$757 million |
| Indiana | +$683 million |
| South Carolina | +$485 million |
| 1 Cash Donor State | |
| Texas | -$942 million |
| Source: FHWA Table FE-221 (FY17) | |
But that $942 million deficit only covers highway funding drawn from the Trust Fund. Over the past two years, Texas has received $427 million in highway formula funding from the general fund ($183 million in FY18 and $244 million in FY19). The Texas letter and accompanying white paper conveniently forget that this money exists. If another budget caps deal is struck between Congress and President Trump, this money can be expected to continue in FY 2020 and 2021, further erasing Texas’s long-term deficit.
One other crucial point needs to be made.
If the Highway Trust Fund is ever made solvent and sustainable from highway user taxes again, there will be a lot more donor states than just Texas.
It is not possible to fund a national highway system without some cross-subsidization between states. Again, just look at the Interstate map shown above, which is the whole reason for the Trust Fund’s existence. Look at the Table FE-221 from 20 years ago – in FY 1997, 21 states were donor states on a dollars-in, dollars-out basis. At the end of 1997, Texas’s cumulative 1957-1997 Trust Fund deficit was $4 billion and their cumulative rate of return (dollars-in, dollars-out) was only 85 percent. (And this was well before the SAFETEA-LU earmarks that the TxDOT white paper alleges biases the current funding formula against Texas.)
The Texas delegation letter does make an important point when it says that underlying metrics “must be brought current. Without using current data, we simply fail to have a true formula distribution.” The problem goes back farther than the letter states – all of the metrics that underlay the old formulas ceased to have any meaning in 2005 when the SAFETEA-LU law said, in essence, “all the formula factors don’t matter – we will add or subtract money from each state as necessary to give each state a fixed share of total funding.”
The Eno Center has been working on a project outlining possible ways in which Congress could write meaningful highway funding distribution formulas once again, if they chose to do so, based on objective needs-based (and/or outcome-based) metrics, which will hopefully be released in the coming months.

