President Biden’s First Budget: An Overview
When the fiscal 2022 federal budget was (finally) released last Friday, I of course spent the first few days (Memorial Day weekend) looking at the transportation items first. Only later did I take a look back at the big picture, which can be summarized fairly briefly.
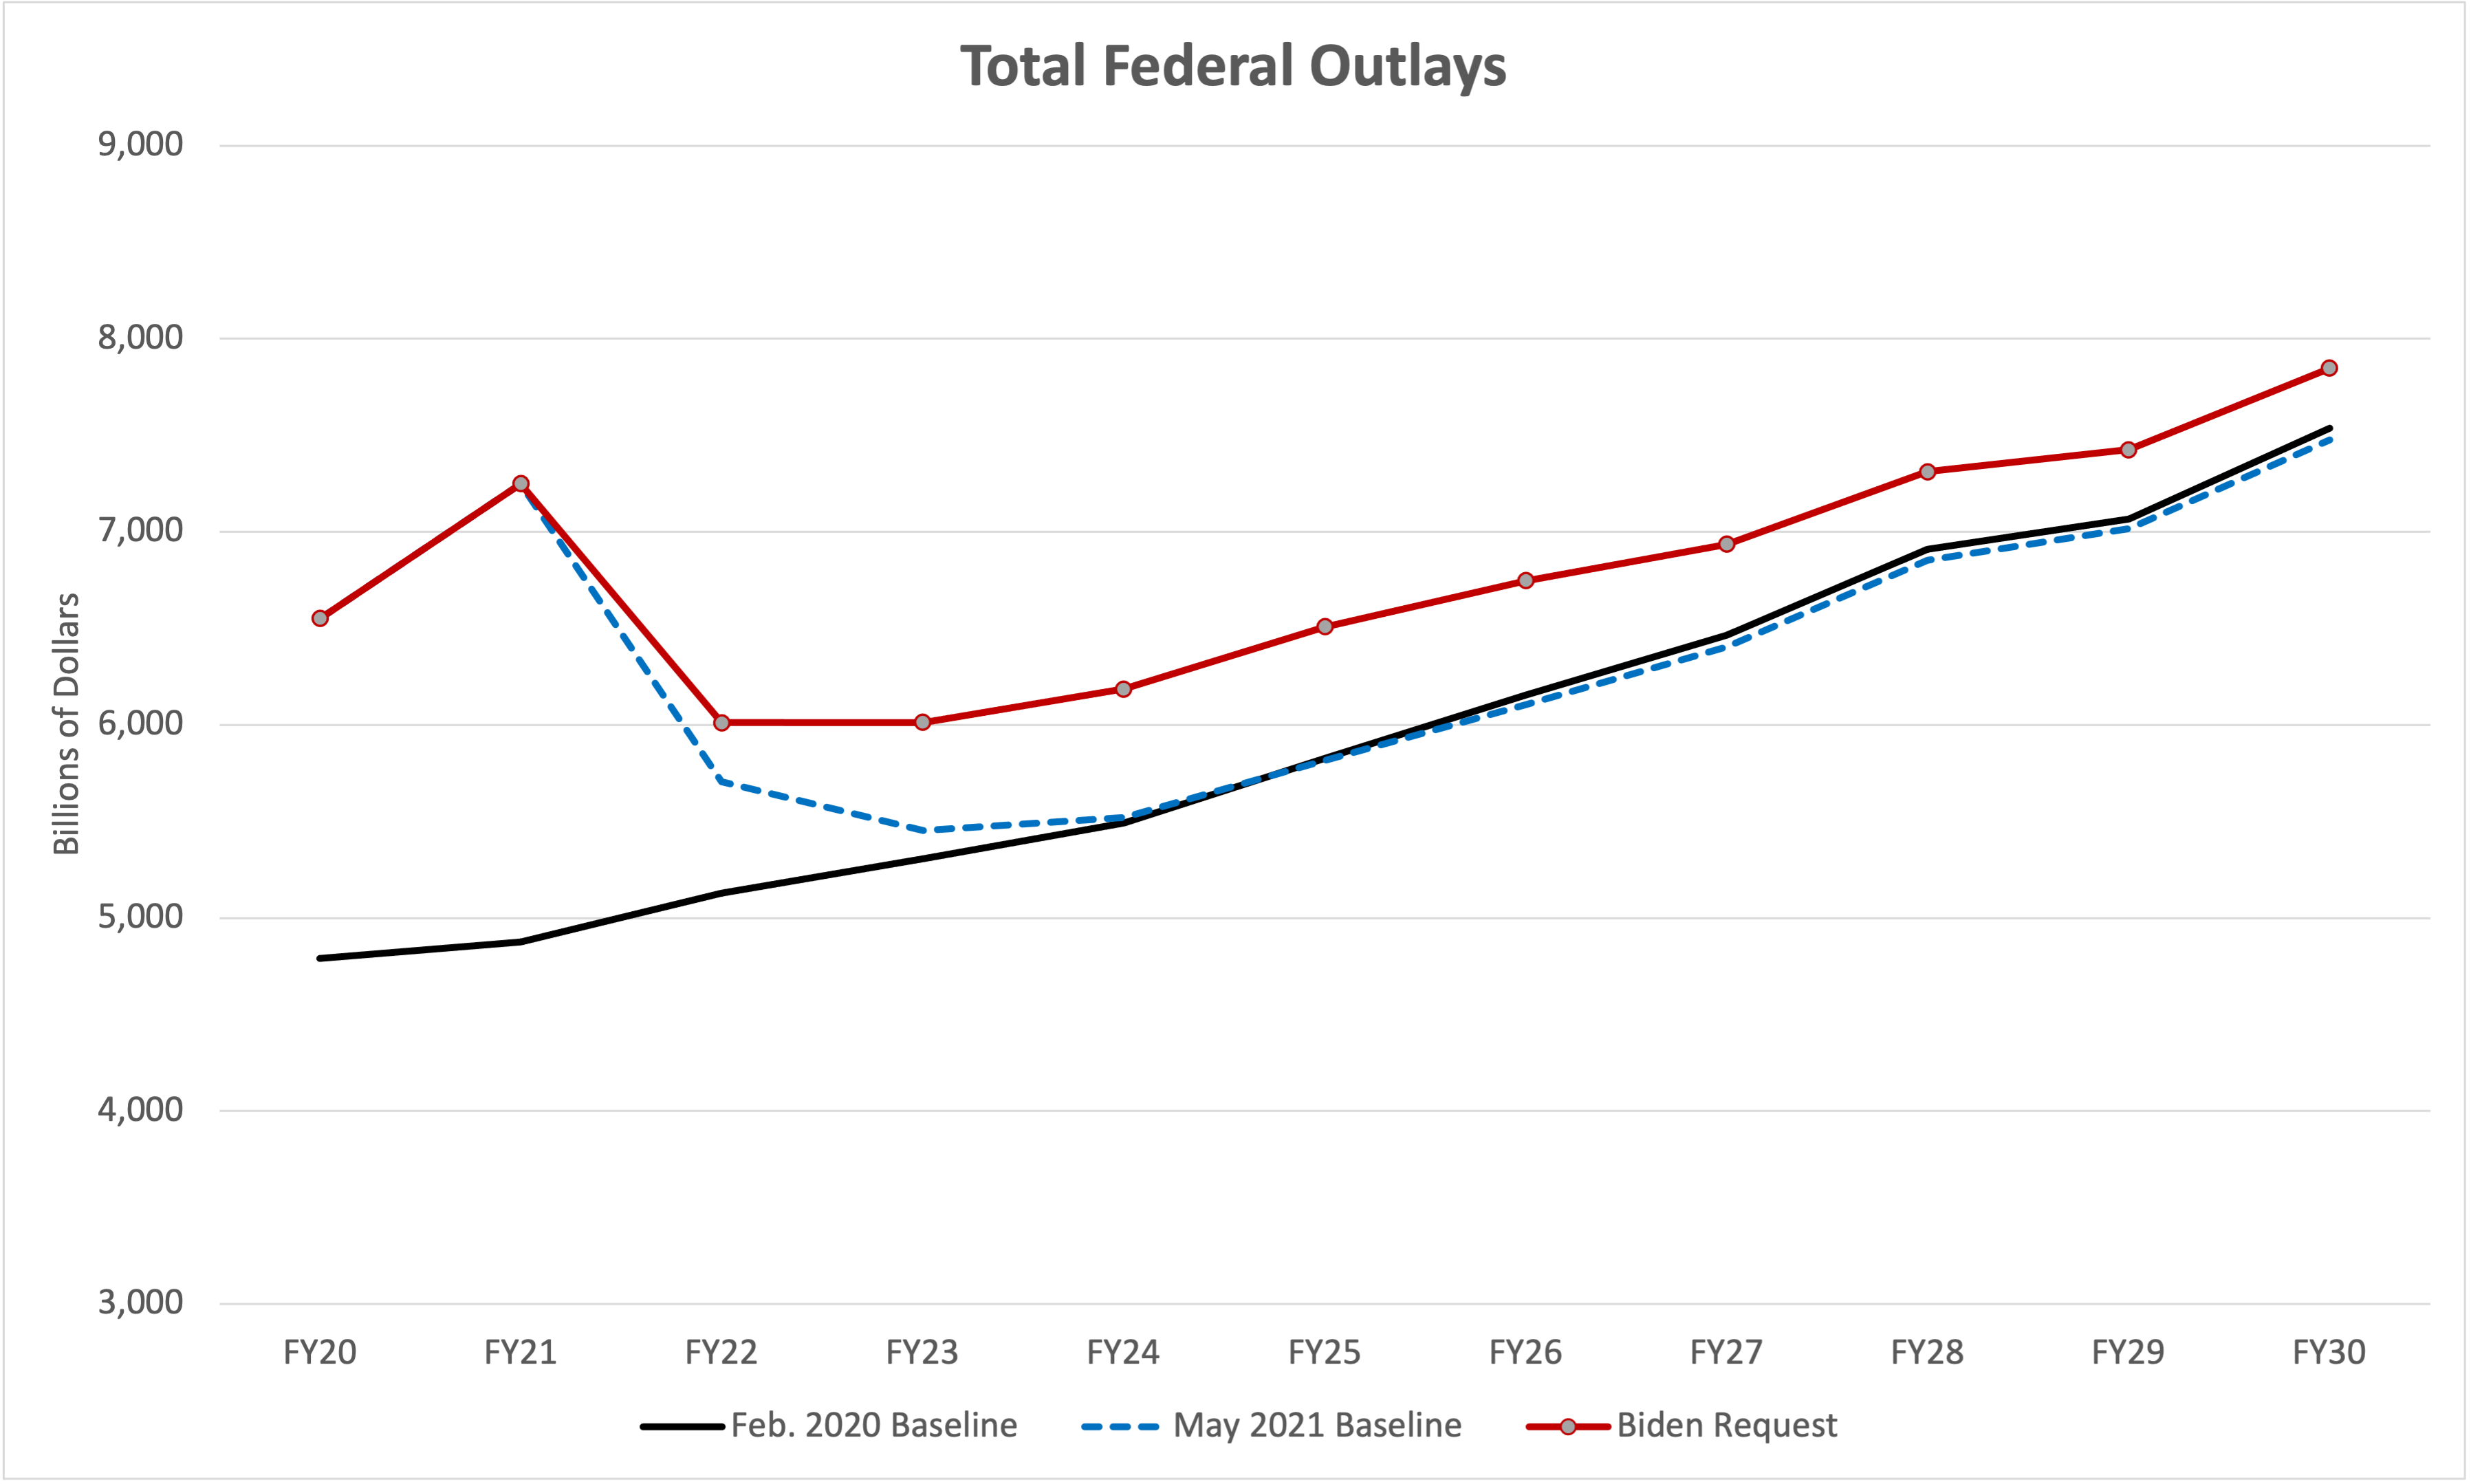
Spending. The big headline was that the budget projected total federal spending (outlays) of just over $6 trillion in 2022 ($6.011 trillion to be exact). But that is down 17 percent from the massively COVID-inflated 2021 estimated deficit, and is only $304 billion above what the Office of Management and Budget predict would be spent at “baseline” levels (i.e. if President Biden achieved zero spending policy changes from Trump whatsoever).
The real spending news is that $6 trillion per year in spending becomes the new “floor” and the budget calls for spending at least that much, every year, forever, passing $7 trillion in 2028 and getting just past $8 trillion in 2031.
It is useful to look at the OMB baseline released in February 2021, just weeks before COVID started changing American life, with the new “current law and policy” baseline released last week. The new spending baseline projects that almost all the COVID-related spending will be fully spent out and gone by the end of 2022, and the 2023-2030 spending levels under the new OMB baseline are almost identical to the spending levels under the last Trump baseline. Which means that nothing that Congress, President Trump, and President Biden have enacted into law from March 2020 to last week has any lasting effect on federal spending beyond 2023. All that the federal government has enacted since March 2020 has been to deal with COVID and maintain ongoing policy.
The following chart shows the two spending baselines and the spending levels called for in the Biden budget, where the vertical axis has been truncated to start at $3 billion and top out at $9 billion.
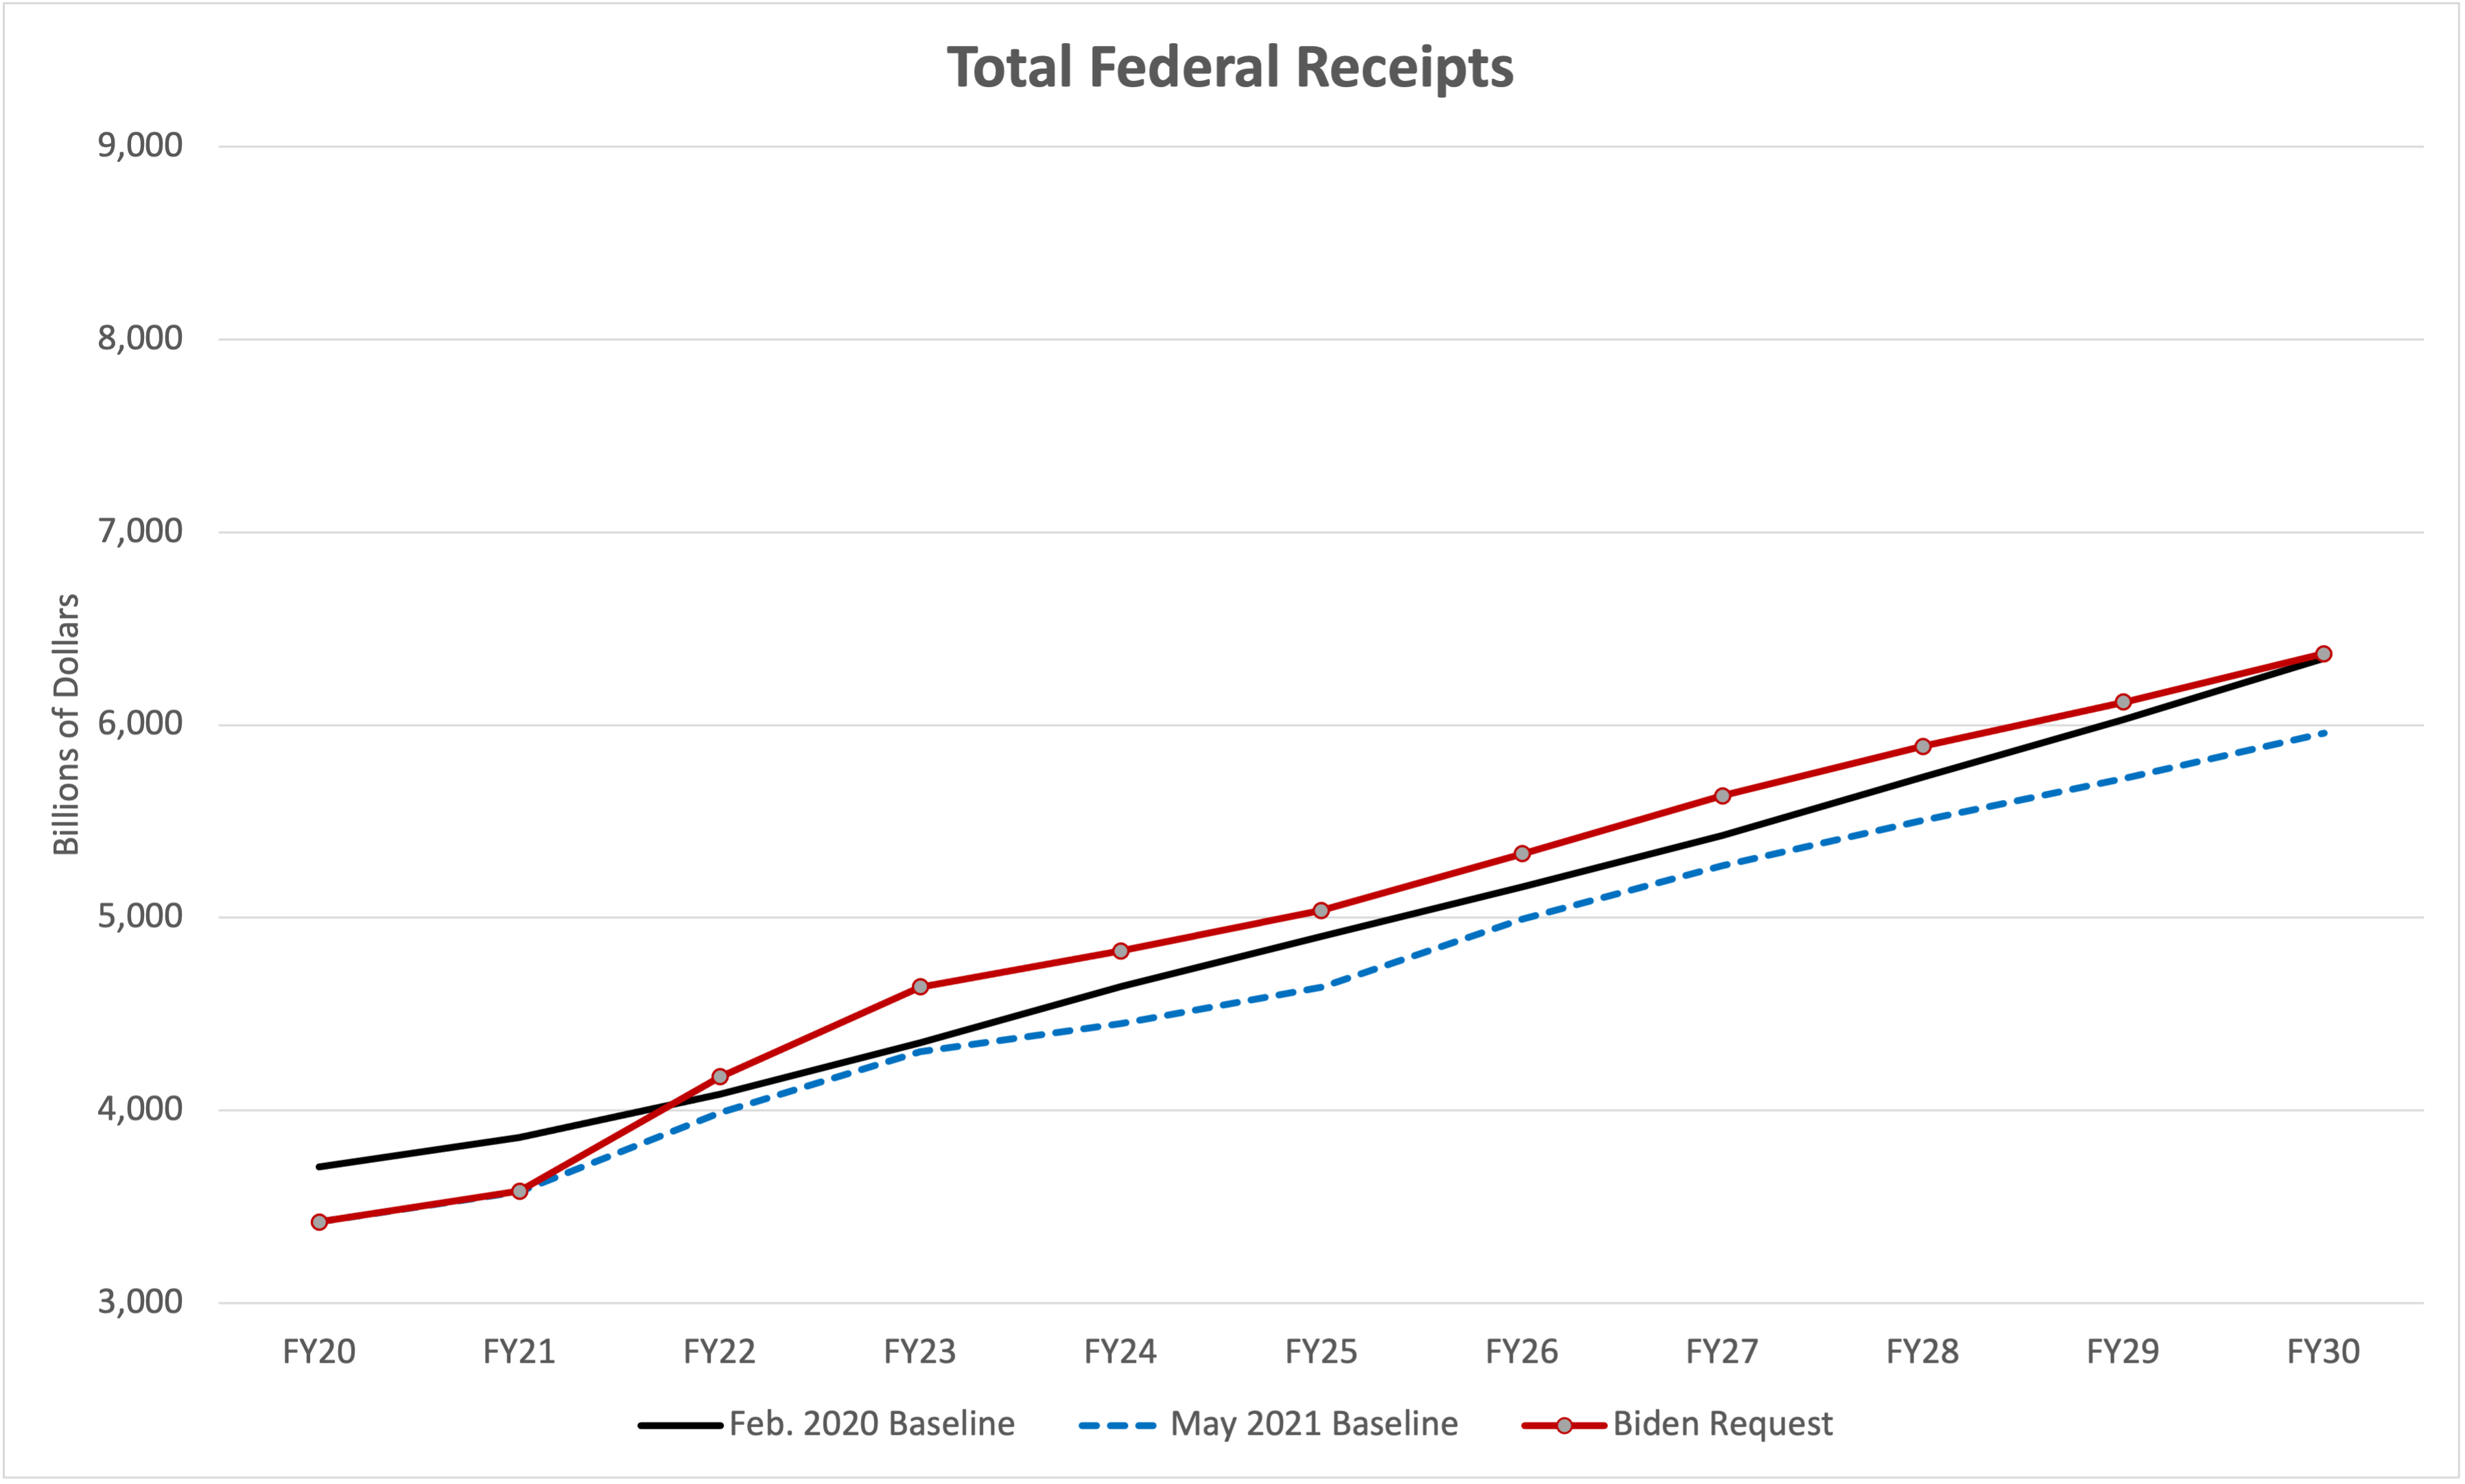
Taxes. On the tax side of the ledger, the last Trump baseline starts out higher than actual 2020 receipts or current 2021 estimates, because of the tax cuts in the early COVID relief legislation and because the brief-but-intense COVID recession had a negative effect on what (delayed) tax receipts remained. Indeed, because of long-term economic forecasts, the new baseline shows federal receipts an average of $242 billion per year lower over the years 2024-2030 than did last year’s Trump baseline.
The Biden tax plan would take tax receipts form an estimated $3.6 trillion in the ongoing fiscal 2021 to $4.17 trillion in 2022 and then rising to $5.04 trillion in 2025 and passing the $6 trillion mark in 2029.
Using the same y-axis scale as the spending chart above, here are the last baseline, the new baseline, and the Biden plan for federal receipts. (Note how much lower on the y-axis they are.)
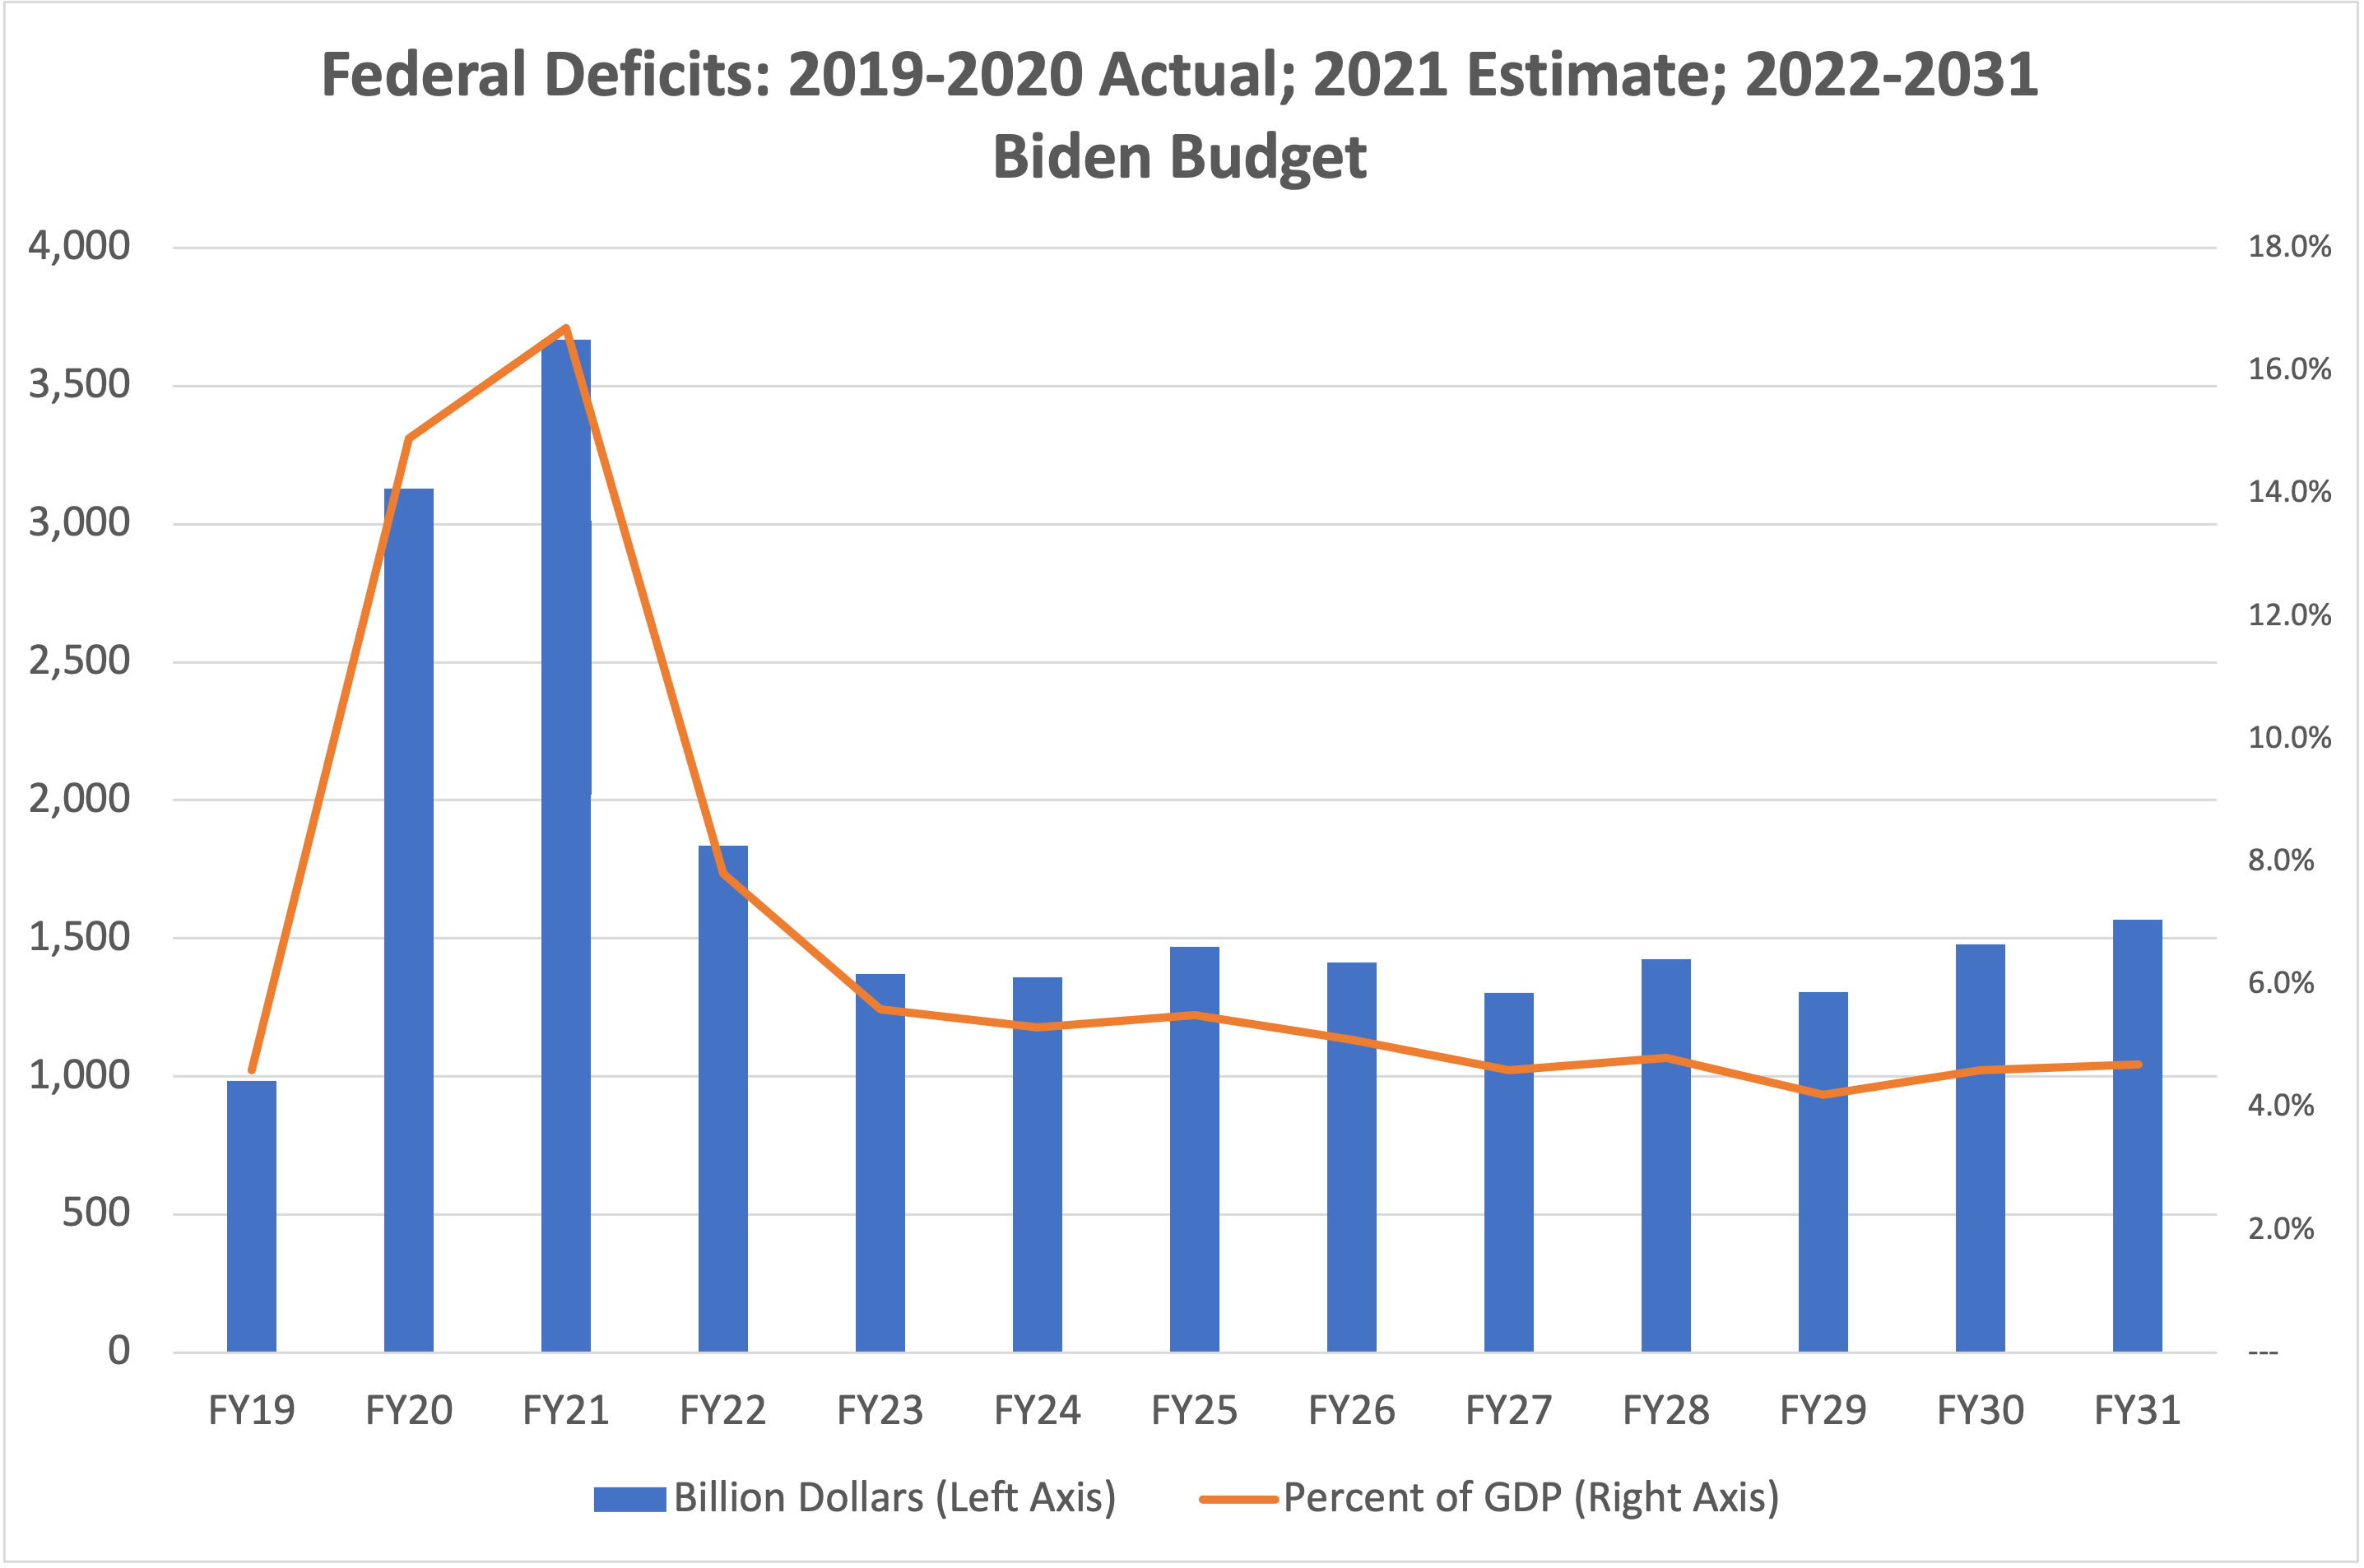
Deficits. The fact that all the receipt numbers were noticeably lower on the vertical axis to the naked eye than were the spending numbers indicates systemic federal deficits. The proposed Biden deficit of $1.84 trillion in 2022 would still be inflated somewhat with previously enacted COVID aid. But the federal deficit would never dip below $1 trillion again under President Biden’s spending and revenue plans.
Deficits would average $1.4 trillion per year over fiscal years 2023-2031 under President Biden’s budget plans (an average of 4.9 percent of gross domestic product (GDP), which is well above the 3 percent of GDP that economists have targeted as the upper bound of the deficit “safe zone” since the 1960s.
(The chart below shows the pre-COVID 2019 deficit and the 2020-2021 COVID deficits as well as the Biden budget plans for 2022 and onwards.)
Economics. We mentioned above that the long-term tax forecast in particular is subject to fluctuation based on the economy. The difference between the White House economic forecast in February 2020 (pre-COVID) is vastly different than the one made by the White House last week. After things get settled down, the economic growth forecast for the future is that the economy will grow one-third more slowly starting in 2023 than was being projected by the last Administration, fifteen months ago.
Real GDP is projected to increase by an average of 1.9 percent per year by the Biden Administration over the years 2023-2030, versus a real growth rate of 2.9 percent per year over that same period in the last Trump budget.
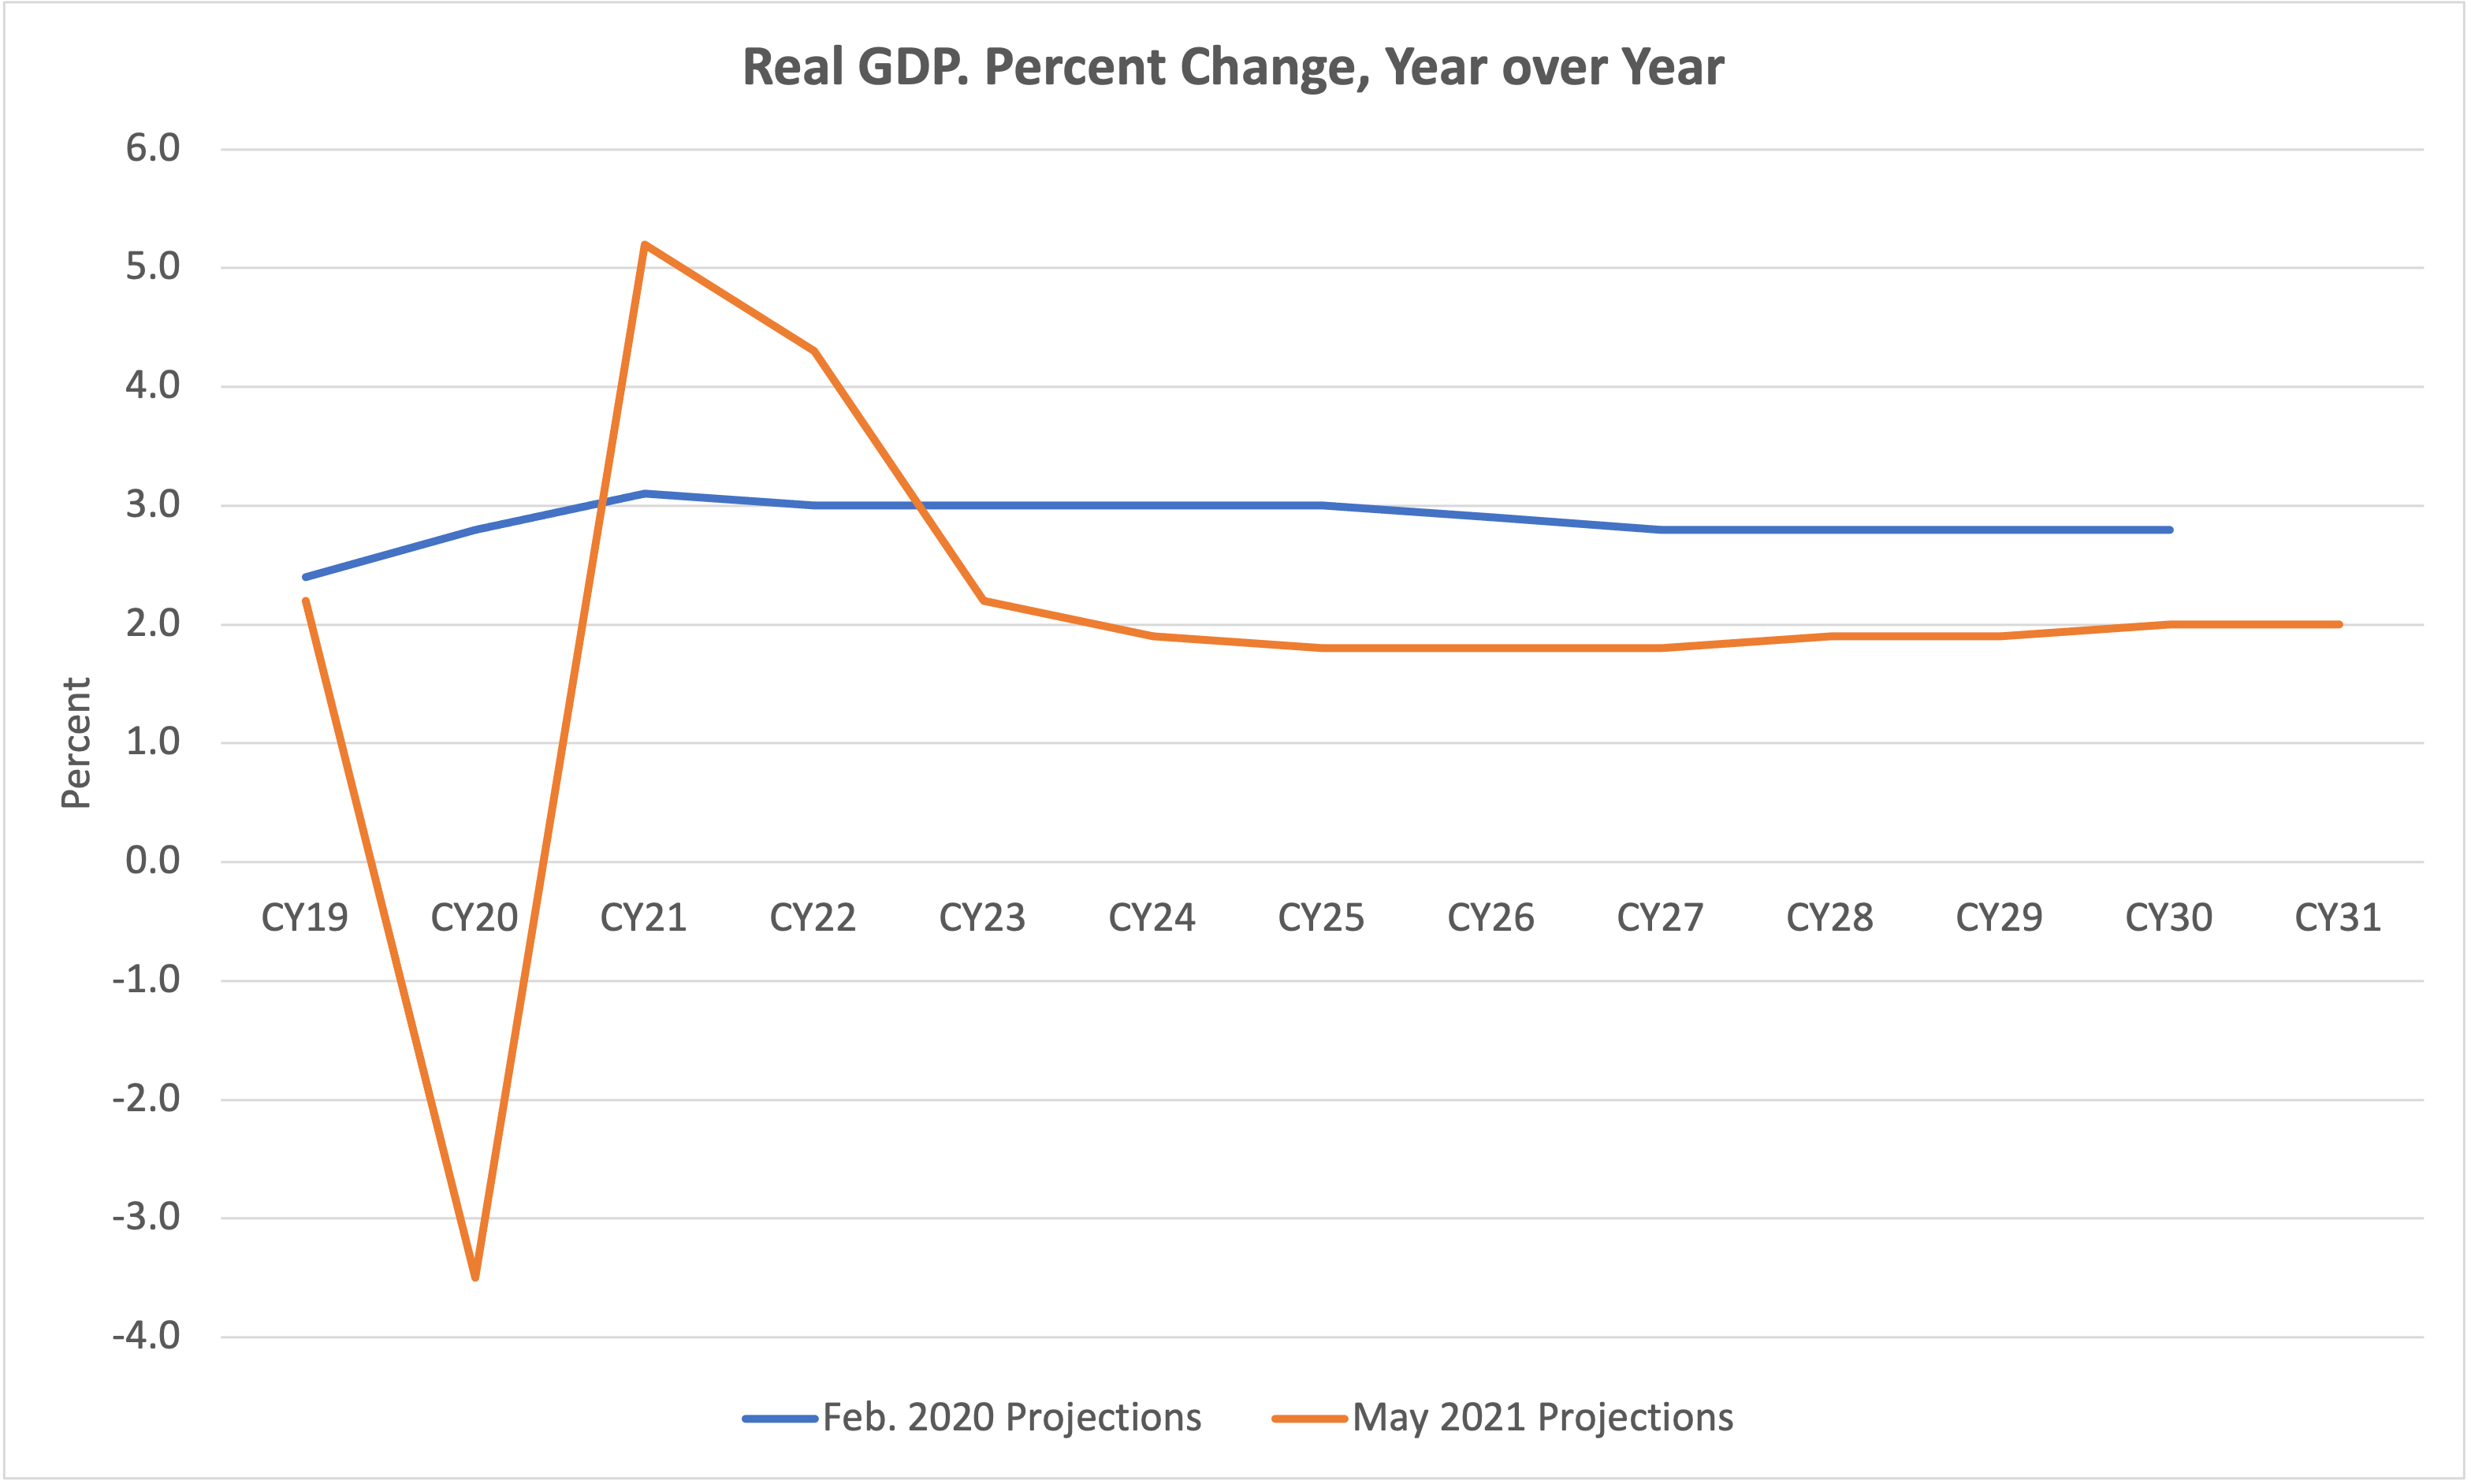
And the economic forecasts accompanying the President’s budget are supposed to assume the economic effects that come from the enactment of the President’s policy agenda, which has led critics to ask precisely where and when the economic growth from the American Jobs Plan is predicted to show up.
There is one striking similarity between the last Trump budget’s economic forecast and the new Biden forecast – inflation. The February 2020 prediction was that year-over-year CPI-U would increase by 2.3 percent per year in every calendar year from 2021 to 2030.
The new Biden Administration forecast calls for 2.1 percent in both of 2021 and 2022, by 2.2 percent in each of 2022 and 2023, and by 2.3 percent per year in each year thereafter through 2031.
At least temporarily, inflation is much worse than that right this minute (as reflected anecdotally everywhere you go and in the April 2021 BLS numbers which were running at a 4.2 percent annual rate).
Major plans. Under the “current law and policy” baseline, over the next ten years, federal receipts are suppose to total $51.0 trillion and federal spending is supposed to total $64.2 trillion, with cumulative total deficits of $13.2 trillion. The Biden Administration has proposals in four major areas that, if enacted, would measurably affect these totals.
- Defense cuts. The President would cut appropriations for national defense by an amount that would reduce outlays by $169 billion below baseline over ten years.
- Non-defense appropriation increases. The President would increase annual appropriations for non-defense programs by an amount estimated to increase outlays by $615 billion above baseline over ten years. (See this article for details.)
- American Jobs Plan. The AJP would have a gross cost of $2.6 trillion over ten years – $2.196 trillion in additional spending outlays, and $403 billion in targeted tax cuts. The plan for paying for part of that spending via offsetting tax increases on corporations would raise an estimated $2.07 trillion in new receipts during that ten-year period, resulting in a net ten-year deficit increase of $529 billion from the AJP.
- American Families Plan. The AFP would have a gross ten-year cost of $1.75 billion, split almost evenly between spending increases and tax cuts. It would then partially be paid for over ten years by $1.48 billion in tax increases, leaving $270 billion in ten-year deficit increases.
All in all, once some mandatory savings proposals and the increased cost of debt service are factored in, all of President Biden’s proposals in the budget would increase deficits by $1.355 trillion over ten years.
| 10-Year (FY 2022-2032) Biden Budget Plan Aggregates (Billion $): | ||||
| Receipts | Outlays | Deficits | ||
| Baseline | 51,038 | 64,215 | -13,176 | |
| Proposed changes in: | ||||
| Defense discretionary | -169 | |||
| Non-defense discretionary | +615 | |||
| Am. Jobs Plan – Cost | -403 | +2,196 | ||
| Am. Jobs Plan – Pay-Fors | +2,070 | |||
| Am. Families Plan – Cost | -828 | +921 | ||
| Am. Families Plan – Pay-Fors | +1,479 | |||
| Misc./Program Integrity | -54 | |||
| Increased debt service | +163 | |||
| Biden Policy | 53,356 | 67,887 | -14,531 | |
| Biden Proposed Change: | +2,318 | +3,672 | -1,355 | |
Summary Table S-2 in the back of the budget does claim that over the following decade (fiscal 2032 to 2041), the AJP and AFP tax increases would exceed costs by an additional $1.726 trillion, and that even after $714 billion in increased spending over that same period (probably due to discretionary appropriations), the “second decade” effect of all Biden proposals would still be $1.012 trillion in deficit reduction.

