BY JAMES B. RICE, JR
Deputy Director – Center for Transportation and Logistics, Massachusetts Institute of Technology
KAI TREPTE
Research Associate – Center for Transportation and Logistics, Massachusetts Institute of Technology
KEN COTTRILL
Global Communications Consultant – Center for Transportation and Logistics, Massachusetts Institute of Technology
Recent disasters such as Hurricane Katrina in 2005, the tsunami that devastated parts of Japan in 2011, and most notably Hurricane Sandy in 2012, have put maritime ports center stage as key points of vulnerability in the global transportation system.
These disruptions also highlighted information gaps in the knowledge of all the ports system in the United States. When Hurricane Katrina slammed into the Gulf Coast there was no reliable source of data on the cargo handling capacity of all domestic ports, and scant information on the regional distribution of cargo types. It is difficult to respond to crises like these by, for example, diverting cargo to non-stricken facilities without a clear picture of the available capabilities and capacities of those facilities.
Since then we have developed an online application called Port Mapper that bridges many of these information gaps, and supports more effective responses to port disruptions. The app was used by the U.S. Coast Guard when the Port of New York and New Jersey was closed as a result of Hurricane Sandy. Port Mapper is now being refined and we believe can play a key role in improving the future preparedness of U.S. ports.
Critical nodes
The importance of maritime ports to the national economy and the well being of our country can hardly be overstated. As author Kurt Nagle noted in his April 2013 Eno Brief article entitled “Investing in Seaports Pays Dividends,” almost one third of the U.S. GDP comes from international trade with 99 percent of that trade coming through seaports. Additionally, seaport activities are responsible for creating over 13 million jobs and upwards of $200 billion each year in various tax revenues.[1]
In recognition of the vulnerability of U.S. ports to serious disruptions, in 2005 the U.S. Department of Homeland Security launched a research initiative that focused on the Maritime Transportation System (MTS). In 2007 these efforts came to fruition with the chartering of the Center for Secure and Resilient Maritime Commerce (CSR).
CSR is developing tools, methods, and management approaches to improving port resilience and security at the national and local levels in an integrated fashion. Stevens Institute of Technology (SIT) is the lead institution and nearly a dozen academic and private industry organizations have become Center partners.
Port Mapper is one result of this collaboration. As mentioned earlier, the beta version of the application has already proved valuable in an emergency situation. To appreciate why, it is necessary to look at how the tool came into being.
Spreadsheet Origins
Our starting point was to conduct a literature review and then go out into the field to understand how the MTS works. This research included visiting many ports, speaking with terminal operators, pilots, AMSCs, USCG representatives, intermodal operators, and port authorities among others. We solicited input via a survey of over 500 parties with a vested interest in seaports. Key questions that surfaced included:
- How much capacity exists in the U.S. port system?
- If a port fails, is there enough capacity for the other ports to handle the cargo coming in and going out?
- In the event of a port disruption, what are the options for alternate ports that could handle the displaced cargo volume?
- Would there be delays and if so, how long?
- How would the delays impact the economy and specific businesses, specific critical necessities for continued operation of the U.S.?
- What actions could be taken in advance to mitigate the potential outcomes?
In order to address these questions, we developed a spreadsheet-based tool populated with Army Corps of Engineers annual cargo volume data by seaport and segmented by SIC code. We augmented this by calculating the land-based and waterborne distances between all domestic U.S. ports. The distances help identify just how far cargo may have to travel if displaced from the original destination port (not all cargo must go to the destination port city).
These initial steps enabled us to analyze cargo inflows and outflows by specific port and cargo type, and to assess options for alternate cargo destinations in the event of a disruption. This had not been done before owing to a lack of suitable data.
Using the scenario analysis tool we are able to identify informed options about re-allocating cargo to terminals in different port locations. And in the absence of documented estimates for current domestic port capacity and capacity utilization, we identified necessary capacities for system resilience. We did this by failing (assuming it was disabled) the largest port for each commodity or cargo type, and then calculating how much of the remaining ports capacities would be needed to handle the displaced cargo.
Some of the results were startling. For example, it became apparent that several cargo types are highly vulnerable based on regional concentrations. Fifty percent of all food and farm products, for instance, pass through three ports that are all located within close proximity in the Gulf. Furthermore, 48 percent of all containers entering the U.S. pass through two co-located ports in Southern California, and 23-35 percent of petroleum products pass through three to four ports situated in a relatively small area in the Gulf.
In order for the MTS to withstand a disruption at any of the largest ports handling specific cargo types (i.e. containers, food and farm products, petrochemicals), all ports processing those cargoes would need an additional 23-50 percent of additional capacity so they could take care of the displaced cargo.
Many other revealing analyses were possible, but this inaugural version of the tool had two key limitations. First, our specialized knowledge of the tool and the associated data was not shared by others making us the only users. Second, the spreadsheet lacked important spatial and visual features.
Our solution was to add visualization to the tool that would make the port concentration issues visually obvious. In addition, we put the tool online in an application that would allow users to engage with the model.
The New Port Mapper
With these enhancements Port Mapper was born in a beta version. It included the geo-coded ports and one simple analytic capability – identification of ports that handle the same SIC code. This one capability would still permit users to ‘fail’ a port and then identify alternate port locations by product type (SIC code), with the results displayed on a Google map. The beta version design was intentionally limited in capability so that we could assess the utility of this new approach, and make it possible to design the interface to be intuitive and simple.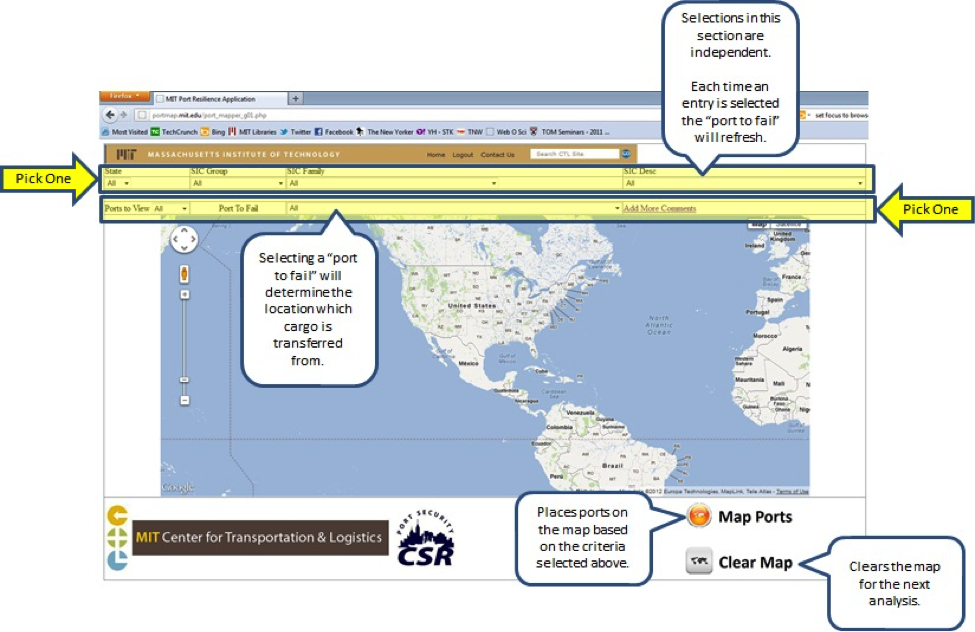
At present, the application is set up to plot and link ports based on the commodities that they handle. The user makes two selections:
- Choice of state or choice of SIC Group/SIC Family or SIC Description
- Choice of all ports or top ten ports, or a specific port by name (note that once you select a specific SIC type, only those ports that handle that SIC will be displayed)
Once the selections are made, the user must click MAP PORTS to display the results. The results will plot and link the ports handling the SIC from either the specific port selected or the largest port handling that commodity if All Ports or Top 10 Ports was selected. After each analysis, the user must start anew to conduct additional analyses.
We have simulated responses to many disruptions using the tool in this way, but there is no substitute for a real-world application, and Hurricane Sandy provided such an opportunity.
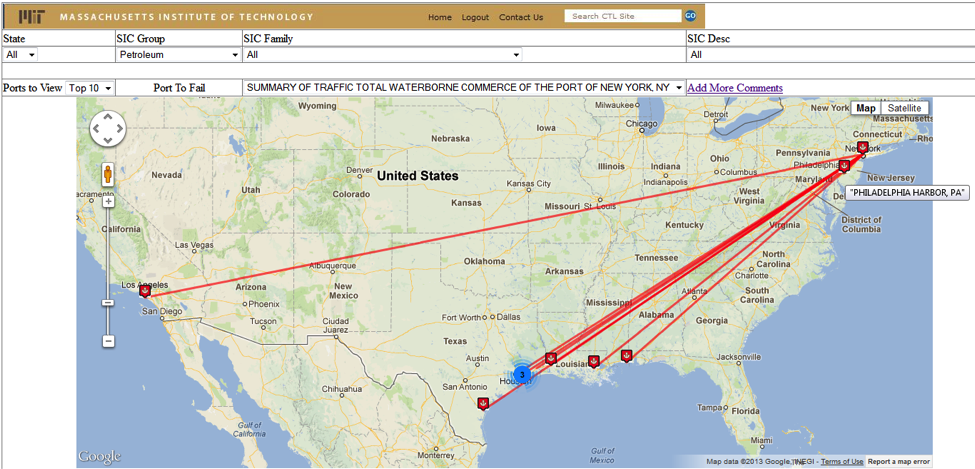
As part of its response effort, USCG used Port Mapper to identify specific alternate port locations by SIC class after NY/NJ was disabled; especially useful given the large number of commodity and conveyance types that flow through this port complex. It is notable that these options are not readily obvious from the manifest. The USCG visualized the redirection of cargo to alternative port locations. While the shippers and carriers are responsible for moving the cargo, it was very useful for the USCG to have knowledge about cargo movement options as they coordinated shipping traffic along the eastern seaboard. While we can’t share the specific analyses conducted, we can imagine the likely analyses. There are surely many ports – well over 300 – that handle cargo in the domestic U.S. One might think therefore that there would be plenty of options for alternate locations for all commodities. But a quick analysis by cargo type shows otherwise. Consider Petroleum – the largest SIC group handled in the Port of NY/NJ. When we identify the options for relocating that cargo type, the Port Mapper reveals a limited set of options (see image). Conducting similar analyses for the broad range of commodities helps to further reveal constraints and limitations, as well as the primary credible options for alternate cargo destinations. One can imagine that this could be very useful for the responder to help improve the efficiency and effectiveness of cargo handling through the best options.
Future Responses
Although the intension was to use the beta version of Port Mapper for demonstration purposes and for soliciting user input, the fact that this initial application proved useful in an actual crisis underscores its potential.
Currently we are working on Port Mapper 1.1 that will have additional features such as pop-up windows showing distances and port volumes as requested by the USCG. A longer term goal is to integrate data on the freight flowing through domestic highways, an addition that could be useful for infrastructure and response planning when cargo flows need to be rerouted.
Threats to the integrity of the MTS have increased in both number and scale over recent years. It is vital, therefore, that we develop more effective ways to protect our ports against disruptions, and establish swifter, more robust responses when disasters occur.
We believe that Port Mapper represents an important step in this direction, and hope that it may be useful the next time that the MTS is compromised to help all stakeholders respond and recover as quickly as possible.
Disclaimer: The views and opinions expressed in this article are those of the authors and do not necessarily reflect the official policy or position of The Eno Center for Transportation.
[1] “Investing in Seaports Pays Dividends” by Kurt Nagle, from Eno Brief April 2013