June 13, 2019
How much money does the federal government currently spend on “infrastructure”? It’s a question that needs to be answered in order to put calls for increased infrastructure spending in perspective. We thought it would be a good idea to put federal infrastructure spending, and “investment” spending in general, into perspective – the relative priority that federal decisionmakers give to these programs in the total budget picture.
The federal budget – big picture.
There is an old saw amongst budget wonks that the best way to visualize federal budget priorities today is to think of the federal government as “an insurance company with a standing army and navy.” The quote apparently goes back to Reagan Administration Treasury official Peter Fisher in 1982 (according to Paul Krugman) (and Fisher went on to bemoan the utter stupidity of an insurance company using cash accounting, as the federal government does). But in terms of “social insurance,” that generalization is fairly accurate – last year, social insurance, national defense, and interest on the debt (a debt generated largely to pay for social insurance and defense) constituted 86 percent of the $4.1 trillion federal spending:
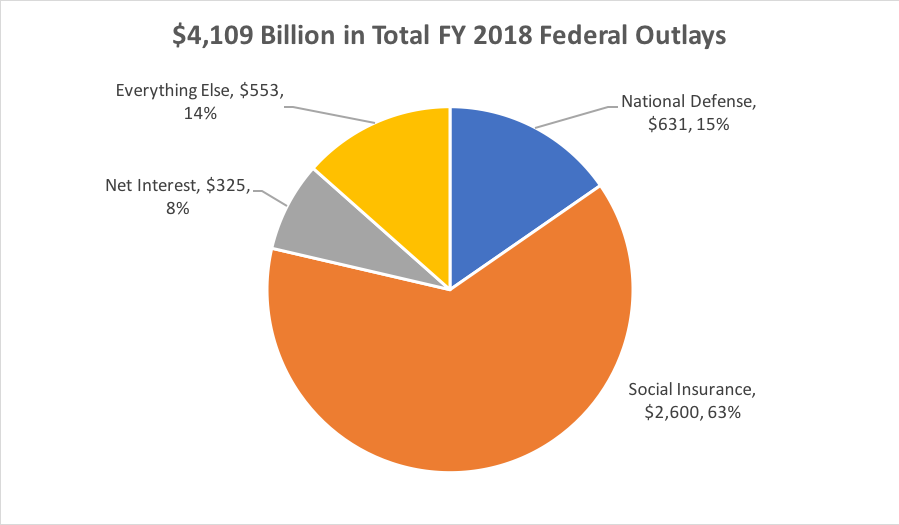
(“Social insurance” spending is defined here as spending in the following budget functions or subfunctions: 351 Farm Income Stabilization, 551 Health Care Services (i.e. Medicaid), 570 Medicare, 600 Income Security, and 650 Social Security, per Table 29-1 in the Analytical Perspectives volume of the FY 2020 Budget.)
Identify “investment.”
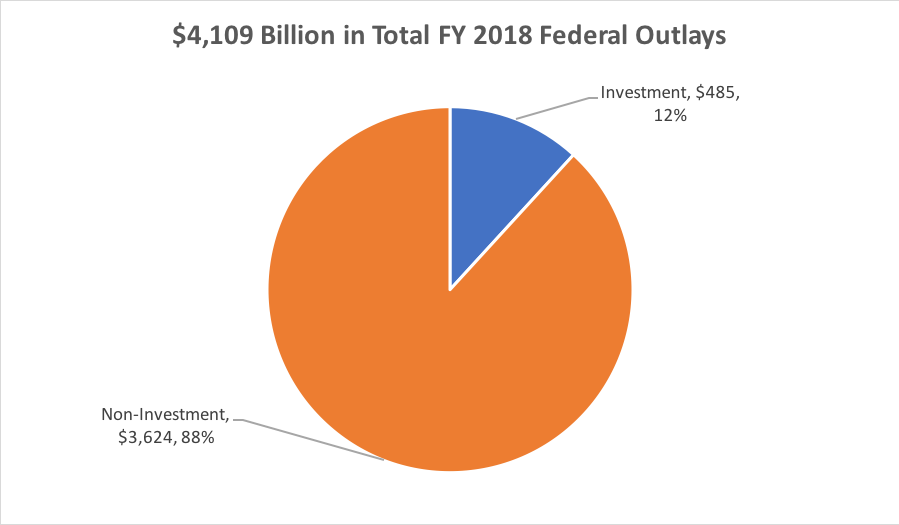
Chapter 20 of the Analytical Perspectives volume of the federal budget describes what it calls what it calls federal “investment” spending, which has three types: research and development, education and training, and “major public physical capital” (the last of which would presumably contain all the capital spending for what we call infrastructure). Overall investment spending across the entire federal budget last year totaled $485 billion, or 12 percent of total federal outlays.
Separate defense from non-defense.
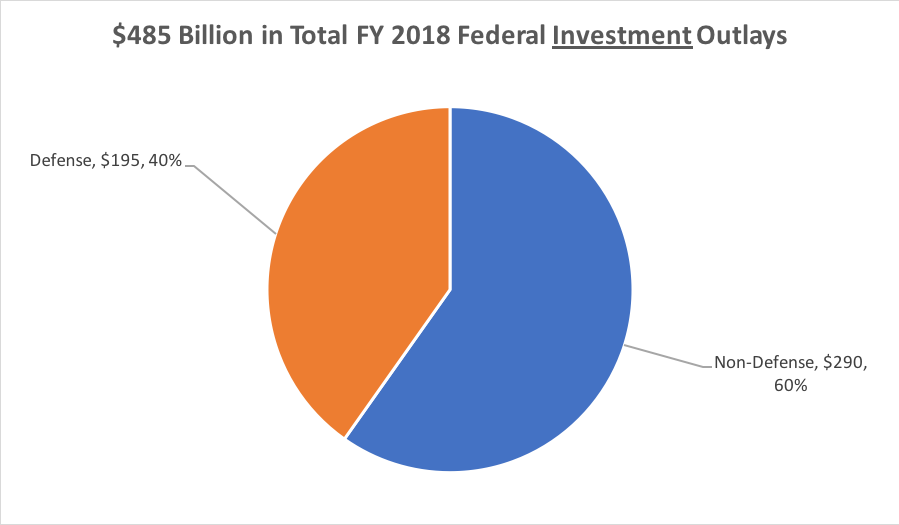
However, quite a lot of investment spending is part of the defense budget, particularly on the physical capital side – the Pentagon spent $138 billion to buy or build ships, planes, tanks, bombs, missiles, etc., which are all capital assets, as are militarily bases and military housing. (And the defense R&D budget last year was $49 billion as well). All told, 40 percent of total federal investment spending last year was in the defense budget function ($195 billion out of the $485 billion).
Separate “public physical capital.”
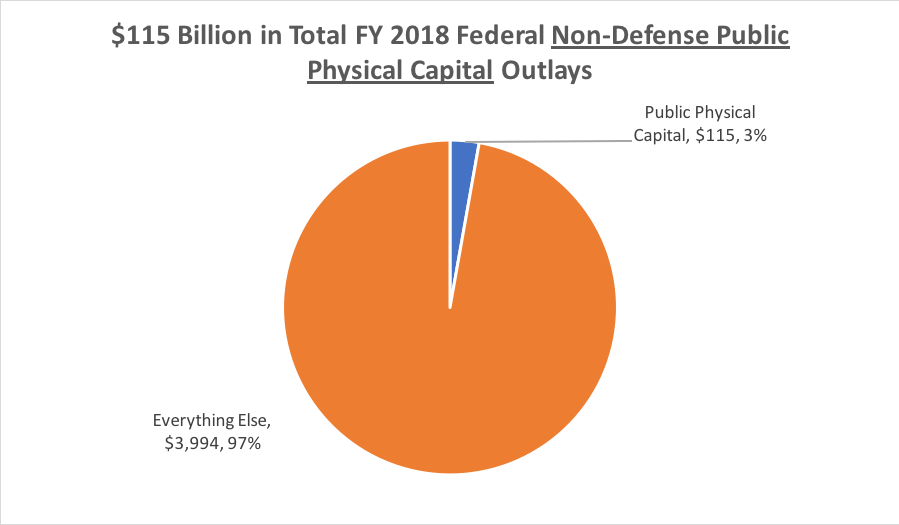
So we’re down to $290 billion in non-defense investment of all stripes. Major public physical capital only makes up 40 percent of this amount ($115 billion) – the remainder is education and training (38 percent) and R&D (22 percent).
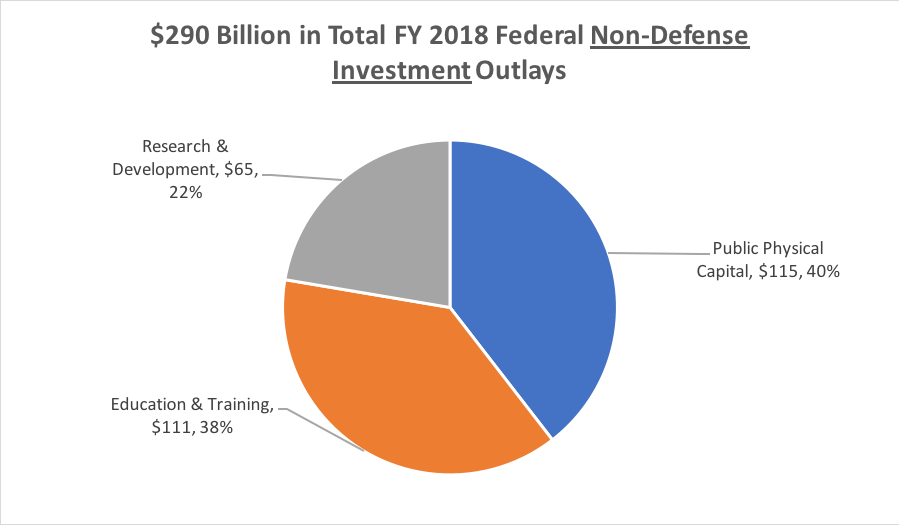
That $115 billion in major non-defense public physical capital constitutes just 2.8 percent of total federal outlays in fiscal 2018.
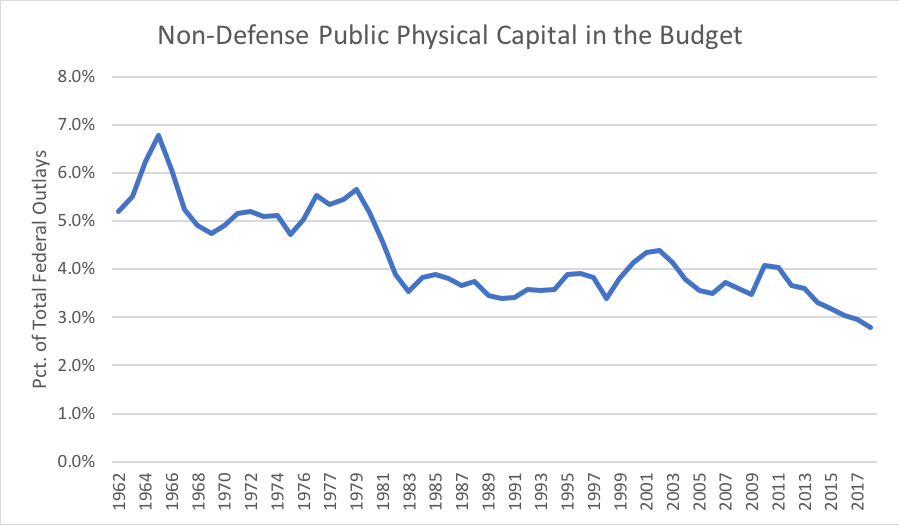
According to the OMB Historical Tables, since 1962 (which is as far back as most of their slicing-and-dicing of spending goes), the peak of major public physical capital (non-defense) as a percentage of total federal spending was in fiscal 1965, when it hit 6.8 percent. The more recent peak was 5.7 percent of total spending, in 1979, which was followed by a long slide – by 1982 (the first full Reagan budget year) it had fallen to 3.9 percent of total spending, eventually bottoming out at 3.4 percent (in both 1991 and 1998) before rallying again. But since the ARRA peak in 2010, another long slide has continued, to this year’s measly 2.8 percent.
Separate direct federal spending from federal grants.
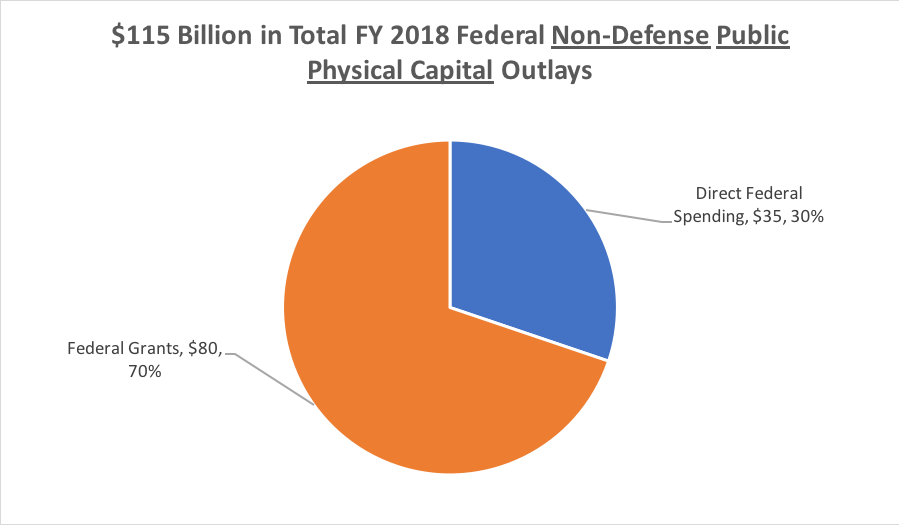
The $115 billion in FY18 federal spending on non-defense public physical capital must first be broken down into two different types of spending – direct spending by the federal government (either carrying out projects directly, or else buying big things for the federal government to use), versus grants made by the federal government to non-federal entities (state and local governments, mostly) to build or buy big things themselves. In FY18, the split was about 70-30, with grants being the bulk of the capital spending ($80 billion) versus $35 billion in direct spending.
Federal direct spending priorities.
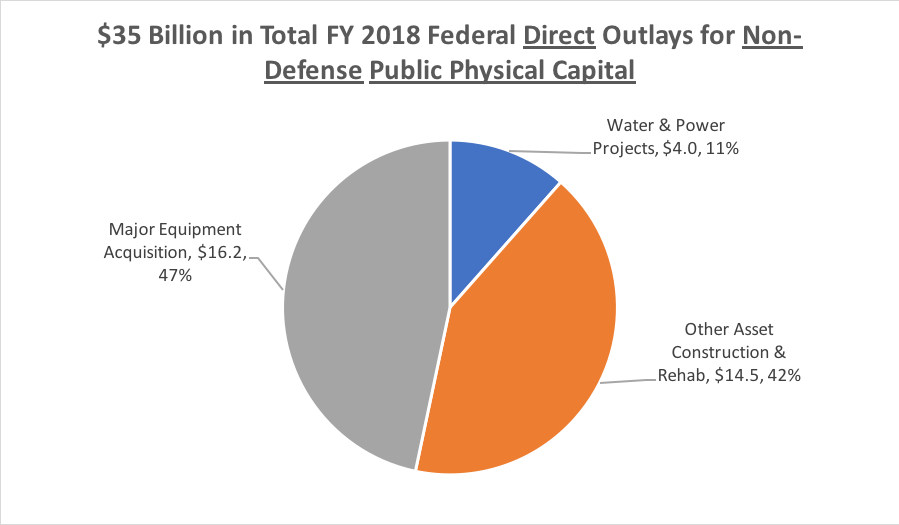
When it comes to the $35 billion in FY18 direct federal spending on non-defense major public physical capital, Table 20-2 in Analytical Perspectives breaks it down by a bit. FY18 was, apparently, an unusually slow year for federal water and power projects (Corps of Engineers, Bureau of Reclamation, TVA, Bonneville, etc.) at just $4 billion (that figure was as high as $10 billion just four years ago). Another $14.5 billion went towards construction and rehabilitation of other physical assets (VA hospitals, GSA federal buildings, CBP facilities, etc.). $16.2 billion went towards the purchase of major equipment (and $4.7 billion of that is for transportation infrastructure – FAA air traffic control equipment and Coast Guard ships and aircraft).
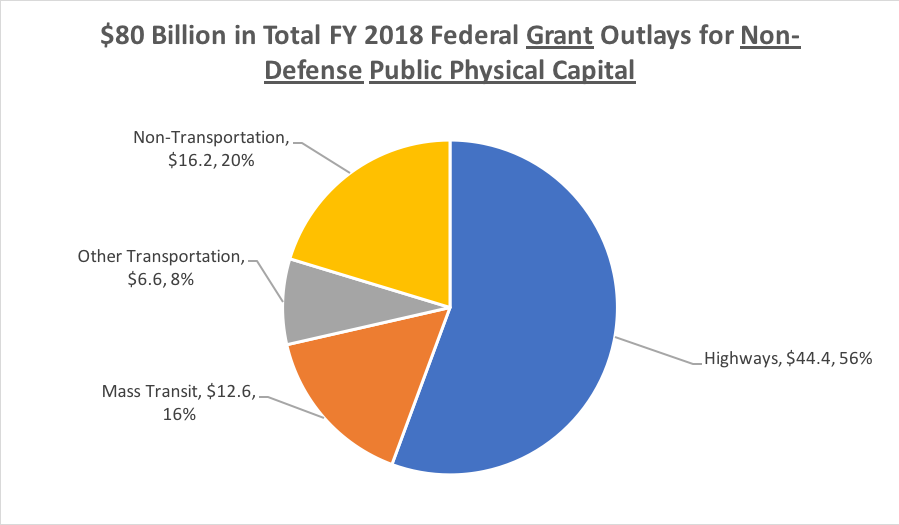
Federal public physical capital grants.
Table 20-2 in Analytical Perspectives also breaks down the $80 billion in FY18 outlays for federal grant programs for public physical capital. Transportation grants were 80 percent of the total ($63.7 billion), with highways at $44.4 billion, mass transit grants at $12.6 billion, and other transportation totaling $6.6 billion ($2.1 billion for Amtrak and other rail grants and $4.5 billion for the airport grant program plus all other transportation grants (EAS/SCAS, pipeline, maritime/shipyard, what have you). The $16.2 billion in non-transportation grants is mostly HUD housing, community development grants, and EPA pollution/water grants.
Conclusion.
The original purpose of looking up these numbers was to put the calls for a big infrastructure bill in perspective – if total federal spending for all types of (non-defense) public physical capital, whether “infrastructure” or not, totals $115 billion per year, and $115 times ten is $1.15 trillion, then adding another $1 trillion (much less $1.5 trillion or $2 trillion) on top of that was always going to be a leap.

