New TRB Report Analyzes “Flex” Transfers of Federal Highway Aid
The Transportation Research Board of the National Academies of Sciences, Engineering, and Medicine has released a new report looking for trends in the ways that states utilize their ability to transfer federal-aid highway funding from one program to another, and out of highways entirely to spend the money on mass transit.
The report, with the (unimaginative) title Federal Funding Flexibility: Use of Federal Aid Highway Fund Transfers by State DOTs, can be downloaded here.
The permission for states to move federal dollars from one highway program to another was first given, on a limited basis, by the 1954 highway act, and gradually expanded (especially once the Interstate system was completed) to the current structure, where states can transfer up to 50 percent of their apportionment for any single highway program to any other highway program. (See Table 3-1 in the TRB report, which was taken from an earlier Eno Center report.)
And the ability to transfer highway apportionments to mass transit dates back to the 1973 highway act.
In addition to having access to detailed data from FHWA, the authors of the TRB study managed to get 38 states and the District of Columbia to respond to a detailed survey of their use of their “flex” transfer authority, then conducted in-depth case studies of five states (Kansas, Oregon, Pennsylvania, South Carolina, and Utah) and two metropolitan planning organizations (Albany and Memphis).
Transfers between highway programs. The report indicates that over the MAP-21 and FAST Act period (fiscal years 2013-2020), states collectively transferred $24.7 billion (8.7 percent) of their total highway formula funding between highway programs. The movement tends to be almost entirely into the Surface Transportation Block Grant Program, which has the fewest restrictions on how states can use the money (over $21 billion of the $24.6 billion being transferred went into STBGP, while only $688 million came out).
As to which programs were the most popular for states to downsize, that depends if you are looking at total dollars (which depends on program size) or the percentage of the program being transferred.
| Program | Total Funding | Transferred Out | Percent. |
| Nat. Hwy. Performance Prog. | $172.8 billion | $18.1 billion | 10.5% |
| Congest. Mitigation & Air Qual. | $18.4 billion | $2.3 billion | 12.7% |
| Highway Safety Improvement | $17.7 billion | $1.9 billion | 10.5% |
| Transportation Alternatives | $6.0 billion | $1.2 billion | 20.7% |
| Surface Trans. Block Grant | $82.0 billion | $0.7 billion | 0.8% |
| Nat. Hwy. Freight Program | $6.1 billion | $0.4 billion | 7.0% |
| ALL PROGRAMS | $303.1 billion | $24.7 billion | 8.1% |
Part 4.1 of the report contains charts showing which states transferred money out of which programs over that period. But the charts are set up to show which state used what percentage of its transfer authority, and the transfer authority is capped at 50 percent of an annual program total being transferred out. So a state using 100 percent of its authority on a program means that they transferred half of the funding out of that program to another program.
No state transferred more than 55 percent total highway funding between highway programs, and only three states (Mississippi, Maine, Utah) transferred more than 50 percent. (Pennsylvania was the lone state to decline to use transfer authority, and 19 other states used less than 10 percent of their total authority.)
Given that NHPP is by far the largest highway program, it is not surprising that the states that utilized the most of their transfer authority also transferred the most money out of NHPP (Mississippi, Maine, D.C., Virginia, Nebraska). The states that got rid of the most CMAQ money were a mixed bag (Alaska was not surprising at #1, but was followed by Georgia, Tennessee, Wisconsin, and Rhode Island).
And five states (Oklahoma, Texas, Georgia, North Dakota, and South Carolina) transferred every dollar out of the Transportation Alternatives program that it was possible for them to transfer.
As mentioned above, states have had this kind of transfer authority for decades, but it was MAP-21 that brought the concept of performance measures to the program. And the report states that “most states find that the requirement to set and meet performance targets in safety, bridge and pavement condition, and other aspects of highway performance and environmental impacts has limited their ability and reduced their desire to transfer funds before they have achieved certain federal policy goals.”
Transfers from highways to mass transit. States and MPOs have the authority to transfer highway formula funding to mass transit, or vice versa, on a project-by-project basis. Almost all of that goes in a highway-to-transit direction, and the report shows that over the MAP-21 and FAST period, those transfers totaled $13.3 billion. This has varied from $1.2 billion to $1.4 billion per year, except in fiscal 2019, where it jumped to over $1.6 billion for no adequately explored reason. (The TRB report does not help in that regard.)
As a percentage of total highway formula funding, this has meant that 3 to 4 percent of total highway formula funding each year gets transferred to mass transit. But the report indicates that there is a huge discrepancy between states as to who transferred what percentage of their highway funding to transit over the 2013-2020 period:
![]()
New Jersey transferred 15 percent of its highway funding to mass transit, and California transferred 10 percent, with Maryland and Oregon not far behind. But that tapers off quickly, with 32 states and the District of Columbia transferring less than 2 percent of their highway funds to transit, and with three of those (D.C., Mississippi, and North Dakota) transferring none at all.
The biggest determining factor on how much money a state transfers to transit seems to be what percentage of the state’s total highway funding comes out of the CMAQ program. CMAQ was created in 1he 1991 ISTEA law to give highway funding recipients more transit-friendly options. Of the $18.4 billion in total CMAQ funding over the 2013-2020 period, over one-third $6.3 billion) was transferred to mass transit. ($3.5 billion of STBG money was transferred to transit, and the transfers from all other programs only totaled $342 million, per Table 5-1 in the report.)
There is no limit to the transfer ability – the report says “The decision to transfer funds to FTA is not subject to the 50 percent limit that applies to transfers among FAHP programs. Some states have transferred more than 50 percent of their apportionments from certain FAHP categories. For example, thirteen states transferred more than 50 percent of their CMAQ funds to FTA during the study period.”
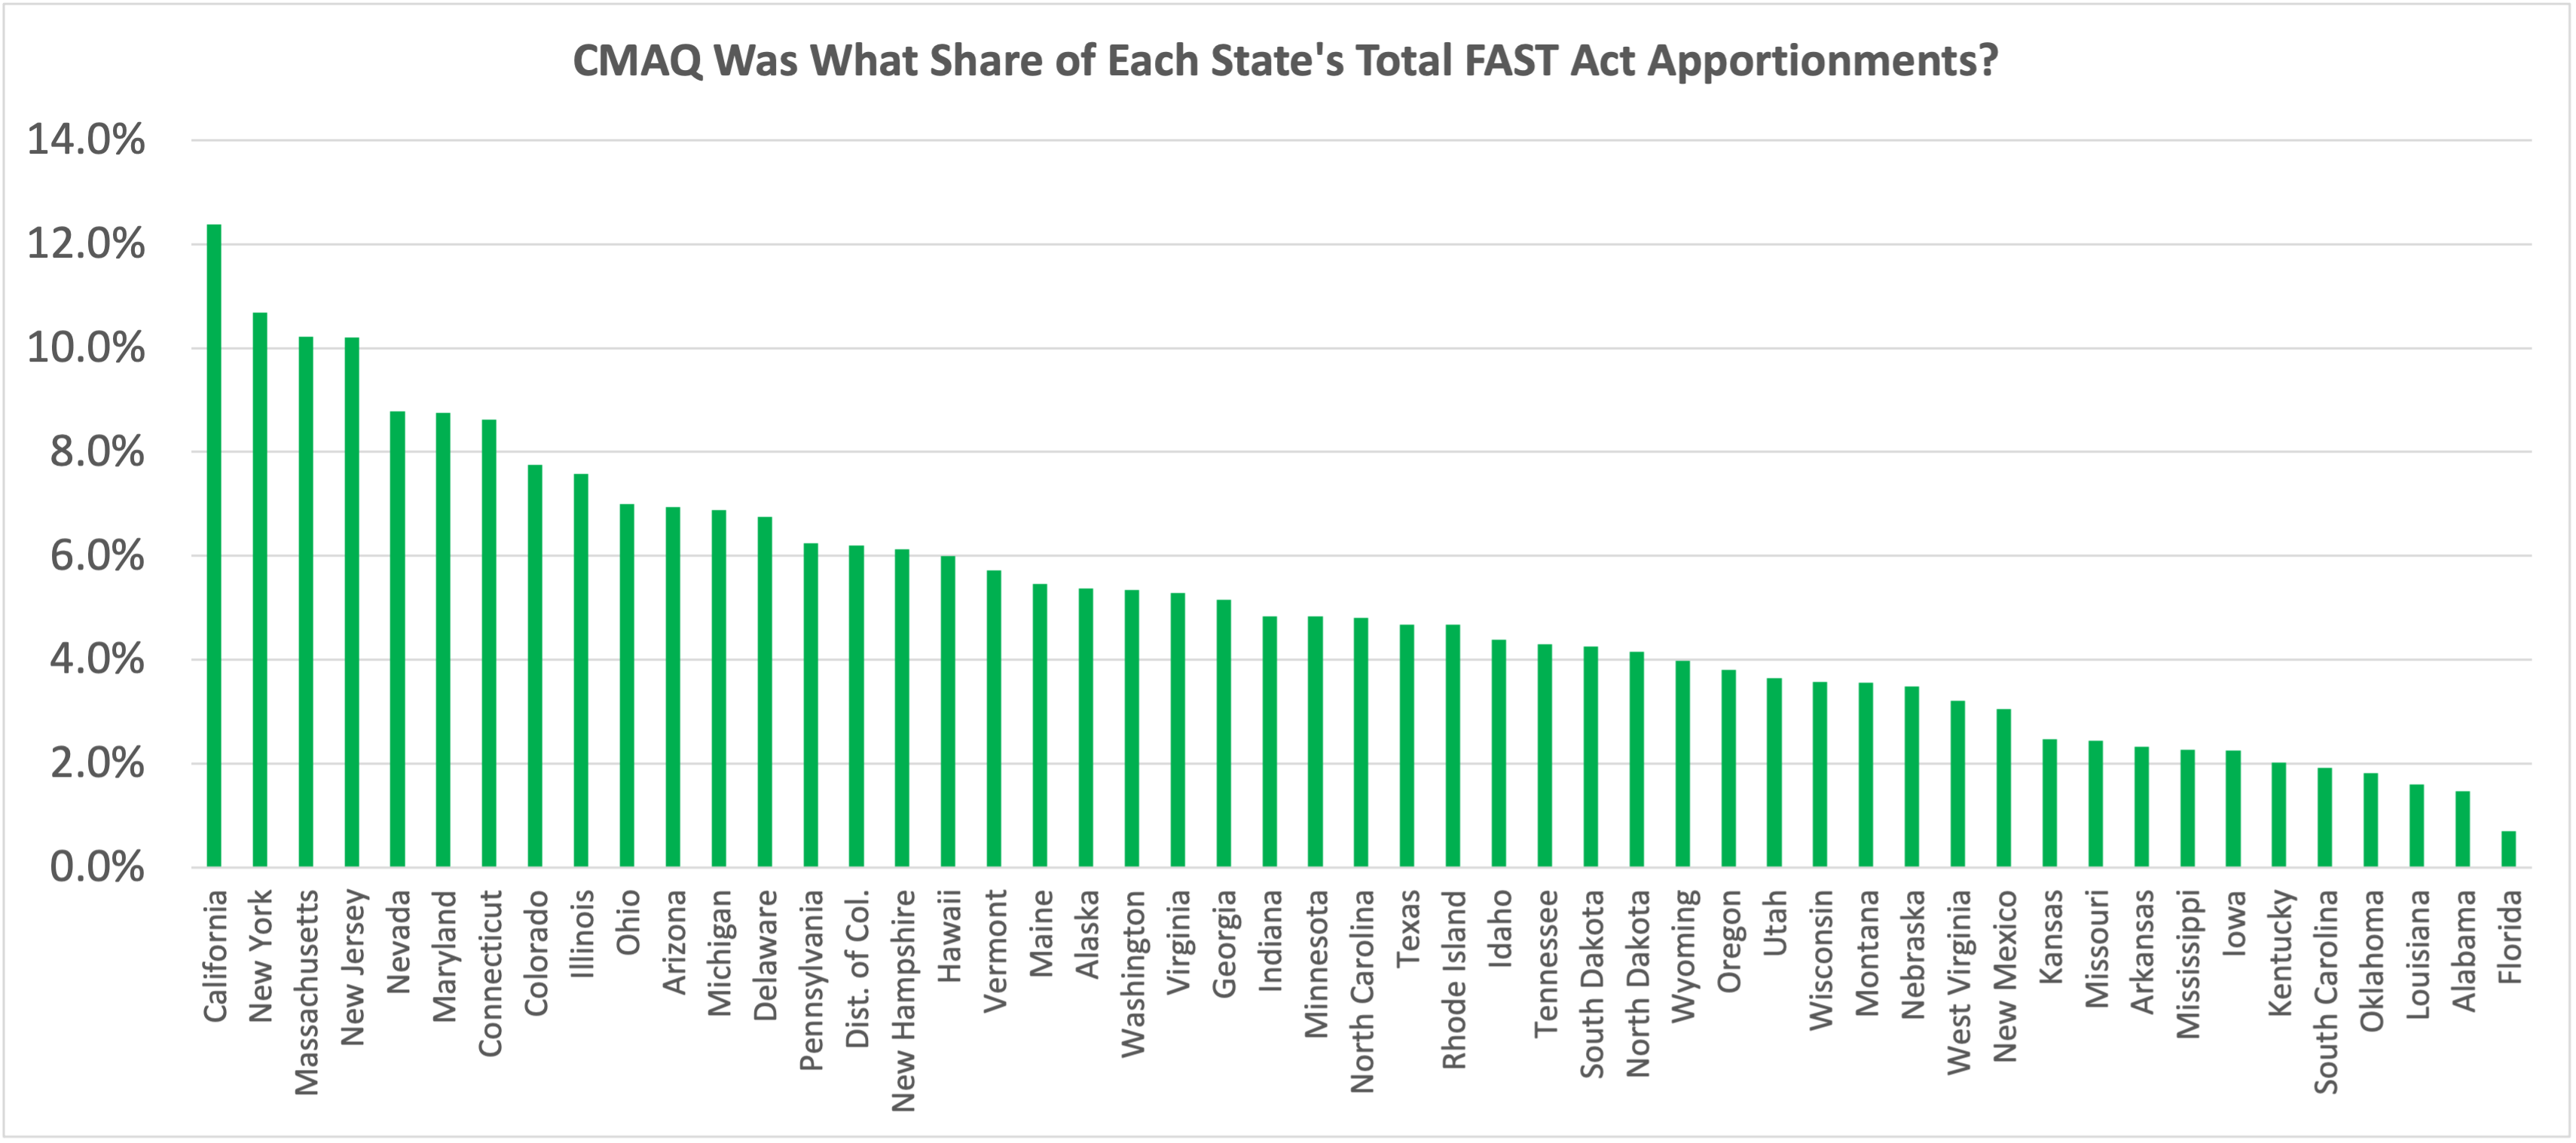
We generated the following chart showing what share of a state’s total FAST Act highway formula funding was apportioned via the CMAQ program. Not surprisingly given the program’s name and origins, California came in first, with 12 percent of its total highway funding coming via CMAQ, followed by New York, Massachusetts, New Jersey, Nevada and Maryland. On the other end, the states that got the least CMAQ money as a share of their total highway funding were South Carolina, Oklahoma, Louisiana, Alabama, and Florida.
To the extent that state decisions to transfer funding from highways to mass transit are based on how much CMAQ money the state receives, it is important to point out CMAQ used to be a needs-based formula, where the air quality in a state’s major urban areas was measured each year for various types of pollutants under the Clean Air Act, and then multiplied by population (and weighted by type of air pollutant). CMAQ funding was then apportioned to states by their share of the total US population living in areas with bad air pollution.
But USDOT stopped measuring that stuff in 2007, and new CMAQ money is still being distributed based on the fiscal year 2009 apportionments, which were based on calendar year 2007 real-world air quality and population totals. (This was a decision of Congress, set in law, not a decision made by DOT.)
(Eno did a whole study on this three years ago, showing how this and other highway formulas no longer made any sense.)

