“Why don’t you stop and ask for directions?”
For decades, the now-anachronistic question encapsulated American identity, self-defined ability, and hubris in eight words. It communicates overconfidence in one’s own navigational abilities, an embedded distrust of others’, and – most of all – the act of getting lost.
As navigation shifted from analog paper maps to real-time wayfinding using dash-mounted and mobile devices that access the global positioning system (GPS) satellite network, travel became significantly more precise and proactive. A far cry from maps of the past, today’s applications allow us to immediately learn when a road is closed, which highways are the most congested, and how to get back on track if we lose our way.
Although GPS has recently been bemoaned for eroding our natural navigational abilities, this technology now allows us to confidently travel around and between our cities with minimal outside interference.
While GPS mapping was groundbreaking, a new revolution is underway that will add a new dimension to the maps we use in order to improve how we understand our environments.
To this end, auto manufacturers and tech companies are now rushing to create sophisticated, ultra-precise maps of cities and every possible inch of road throughout the United States. The primary objective is to build functional and thorough digital representations of urban environments that autonomous vehicles, drones, and other automated technologies can use to safely navigate to any destination.
Simultaneously, a burgeoning sector of startups and private citizens are harnessing broad swaths of data to optimize everything from public transit utilization to accessibility to bikeshare utilization.
Combined, these initiatives are having a profound effect on how we interact with our built environment and serve as a basis for understanding cities in the digital age.
The Automated City
Despite a well-documented proclivity for causing collisions, the greatest strength of human drivers is the ability to improvise while driving by responding to unexpected obstacles and changing conditions on the road. When confronted with traffic jams or instructions from construction workers and police, it is a driver’s spatial awareness – rather than an app’s instructions – that allows them to steer clear of obstacles that are not shown on their phone’s two-dimensional map.
If autonomous vehicles were to operate simply on the basis of current mapping software provided by Google or Apple, they would face innumerable obstacles in situations from unexpected road work, accidents, or newly installed traffic signs with conditions such as “No left turn from 7am-9am”. As an even greater hazard, autonomous vehicles may not be able to detect lane markings and signals in inclement weather or if they are obstructed by snow.
For this reason, autonomous vehicle developers have set out to catalog every aspect of city streets, highways, and infrastructure that can be captured. Using satellite imagery as a foundation, these companies deploy mapping vehicles with LiDAR (Light Detection And Ranging technology) to develop granular, three-dimensional models of the environment – effectively creating digital carbon copies.
The map below illustrates the granularity of information collected in these digital maps: lane markings, traffic signals, bike lanes, speed limits, street signs, and everything visible from the street.
")
(Source: HERE)
The widely-recognized value of precise mapping has triggered a gold rush in the past couple of years, as automakers and tech firms alike race to acquire and partner with the startups and subsidiaries driving this innovation. HERE Maps, which produced the image above, was purchased from Nokia for $3.1 billion by German automakers Audi, BMW, and Daimler in 2015 – with the overt intention of using the technology in autonomous vehicles. This summer, Ford followed suit by investing in 3-D mapping provider Civil Maps during a $6.6 million seed funding round this summer.
For its part, Uber has placed a significant emphasis on collecting and analyzing data from its drivers’ trips, supply-demand modeling, and on-the-ground mapping efforts at home and abroad, including Canada and Mexico. To fuel its aggressive push, the company plans to spend $500 million on global mapping – in addition to partnering with navigation company TomTom, acquiring mapping software developer deCarta, and absorbing 100 Microsoft Bing employees with expertise in the field.
Because autonomous vehicles will refresh digital maps with increasing regularity and granularity, the information could prove valuable for municipalities, metropolitan planning organizations (MPOs), and state departments of transportation. If the collected data is shared with these agencies, it would unlock an unprecedented opportunity to assess public works priorities based on congestion, faded lane markings, and deteriorating infrastructure.
The Livable City
Meanwhile, civic-minded startups and private citizens have focused on improving existing maps to facilitate multi-modal transit, optimize travel for people with disabilities, and understand how city bikeshare programs are utilized.
The imaginatively named Transit App develops digital, user-friendly maps that include every available mode of transit in 55 cities. The app integrates real-time updates on public transit departures and bikeshare availability – as well as estimated trip times and fares provided by Uber.
Transit App bridges the gap between transit agencies – which often do not show other options in the city on their system maps – by displaying every available mode at once. This allows travelers to have a full picture of their preferred transit options, as well as others that are open to them.
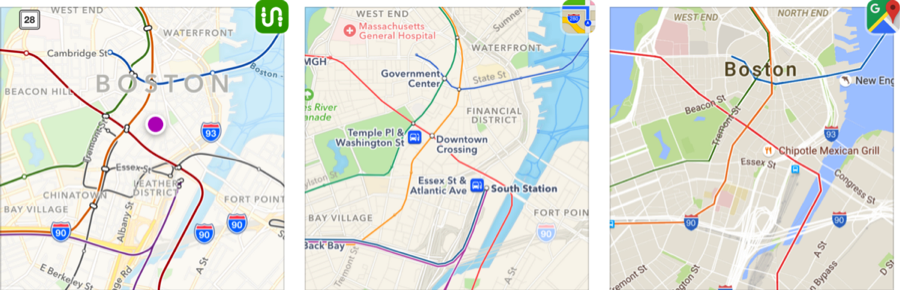
(Source: Transit App – Transit in Boston: Showing the T, Commuter Rail and Silver Line — Boston’s BRT)
Efforts to improve city livability extend well beyond transit. Although compliance standards outlined in the Americans with Disabilities Act (ADA) sought to make public spaces more accessible, some city infrastructure and private companies have fallen short.
For an estimated 56.7 million Americans living with disabilities, the built environment can present challenges and hazards. Sidewalks that are cracked or obstructed by construction work can be significant obstacles to those with limited mobility. Moreover, avoiding sidewalks that lack curb cuts often forces individuals in wheelchairs to “backtrack one or two blocks, sometimes even a mile, to find a way to cross,” says Steve Luker, co-creator of the accessibility app Chi Safe Path.
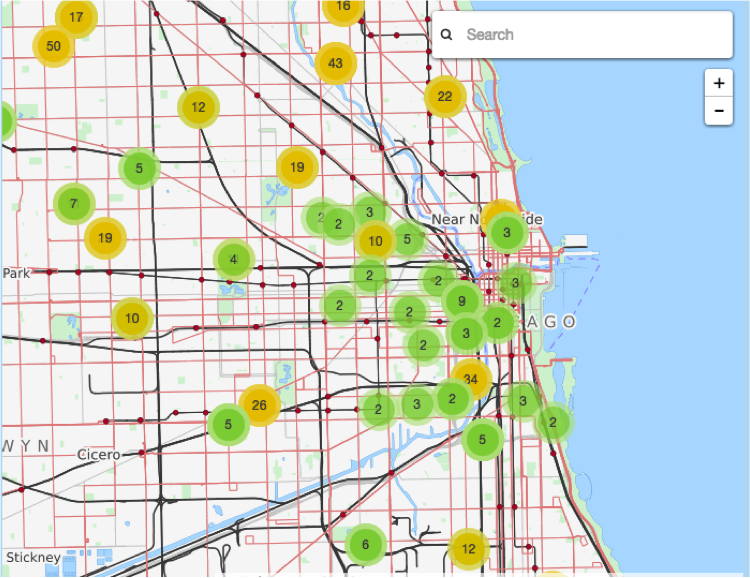
(Source: Chi Safe Path)
Chi Safe Path, which is integrated with Chicago’s 311 system, allows users to report accessibility hazards to the city while informing others of potential obstacles. After the reports are submitted to the city and open for review, the location of the obstacle in question is overlaid on a map of Chicago’s streets and public transit options. To assist users further, Chi Safe Path also generates optimized traveling directions that help them to avoid reported hazards.
Finally, new maps of our cities can help us to understand how programs like Washington, DC’s Capital Bikeshare are used by its members and casual users.
This year, Jon Wergin used GPS data collected from Capital Bikeshare to map 3,596 bikeshare trips to measure the basic qualities of each trip (e.g. duration, speed, distance) as well as the specifics (location, available bike lanes, and duration that tourists stopped at each monument).
The result is a tangible product that city planners can reference as they determine where to build future bike lanes.
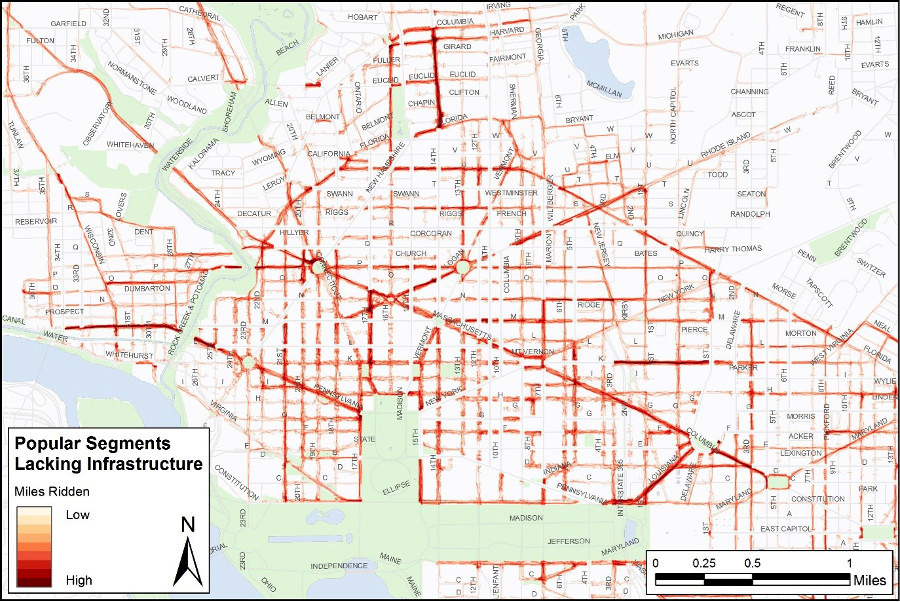
(Source: Jon Wergin – Capital Bike Share Maps – CityLab)
The way that we map our world – and the information we use to represent it – plays a tremendous role in how we traverse our cities and understand our own movements through them. As mapping technology continues to develop, opportunities to understand the digital city will continue to present themselves through the democratization of data and efforts to make our streets safer with autonomous technologies.
(And in case you have not seen enough maps, a mesmerizing visualization of 3,569 Capital Bikeshare trips in one day can be viewed here.)

