Looking to the Horizon: How Agencies are Anticipating the Mass Transit Fiscal Cliff
This is the second article in a multi-part series exploring the looming mass transit fiscal cliff
Eno’s analysis of the National Transit Database shows the size and scope of the looming mass transit fiscal cliff. Agencies where fares cover a high percentage of operating costs, and those that have large farebox revenue values, depend heavily on COVID-related aid while ridership continues to recover. Smaller agencies tend to have less of an issue, as they depend less on fares to cover operating costs and have more COVID aid relative to those costs. As pandemic aid runs out before ridership recovers, agencies will face significant operating budget deficits: a fiscal cliff. The following analysis examines how agencies are predicting and planning for these deficits.
The table below shows 10 of the most fare dependent agencies, which Eno reviewed for this analysis (New York MTA is divided into its four largest operating divisions). We originally planned to examine 17 agency budgets, but seven of those did not have complete information available and could not be included in this analysis (Northern Indiana Commuter Transportation District, Hudson Transit Lines, Potomac and Rappahannock Transportation Commission, King County Metro, Maryland Transit Administration, Port Authority Trans-Hudson Corporation, and NJTransit).
Table 1: Agency Farebox Reliance of top Farebox Dependent Agencies in the United States
| Transit Agency | 2019 Agency Farebox ($ millions) | 2019 Agency Operating Expenses ($ millions) | 2019 Farebox Recovery Ratio (%) |
| Peninsula Corridor Joint Powers Board (Caltrain) | 103 | 140 | 73% |
| San Francisco Bay Area Rapid Transit District (BART) | 483 | 673 | 72% |
| Metro-North Commuter Railroad Company, (MTA Metro-North Railroad) | 758 | 1,265 | 60% |
| Virginia Railway Express (VRE) | 42 | 77 | 54% |
| MTA New York City Transit | 4,608 | 8,755 | 53% |
| MTA Long Island Rail Road (LIRR) | 769 | 1,507 | 51% |
| Northeast Illinois Regional Commuter Railroad Corporation (Metra) | 366 | 782 | 47% |
| Massachusetts Bay Transportation Authority (MBTA) | 672 | 1,506 | 45% |
| Chicago Transit Authority (CTA) | 589 | 1,448 | 41% |
| Southeastern Pennsylvania Transportation Authority (SEPTA) | 462 | 1,321 | 35% |
| Washington Metropolitan Area Transit Authority (WMATA) | 666 | 2,001 | 33% |
| NY MTA Bus Company | 225 | 854 | 26% |
| Los Angeles County Metropolitan Transportation Authority (LA Metro) | 281 | 1,919 | 15% |
Source: National Transit Database
The inaccessibility of transit agency budgets and key budget metrics makes this analysis challenging. In order to address the fiscal cliff problem, we need to know both when these fare-dependent agencies are expected to run into a revenue cliff and how big that gap will be. But among agencies with high fare revenue risk, when and how the budget gap affects them varies widely, and in many cases, it is difficult to identify. In addition to inconsistently available budgets, we found three issues that will make it difficult for policymakers to develop a unified and timely response.
First, the approach to transit agency budgeting varies widely.
While all agencies are required to report financial (and other) data to the Federal Transit Administration, how they develop their budgets follows the varied and decentralized nature of transit governance. Publicly available agency budgets we examined ranged from one-page tables to 130-page documents of varying scopes, with some detailing operating expenses only and others also including capital expenses. Inconsistencies exist in cost classifications, for example, with certain state of good repair costs. The line items in these budgets are also not consistent, with various naming schemes and categories for fare revenue, other revenue, federal subsidies, state subsidies, local subsidies, and debt service. Agencies receive different types of grants and tax revenue, and they have different ways of categorizing operating expenses, including personnel, equipment, administrative, and other costs.
An agency’s operating revenue can come from a variety of different sources that are not readily apparent in the budget, making them difficult to compare. In many of these budgets, federal pandemic relief money was classified into existing categories of federal grants and other subsidies, instead of enumerating them separately. Of the 10 agencies, only four specifically called out how much pandemic aid was spent each year. Such accounting can make it difficult to determine how much aid money an agency still has available to spend and makes it almost impossible to calculate a budget gap if an agency has not already indicated what they expect it to be.
Budget timing also varies widely from agency to agency. For example, of the 10 budgets reviewed, New York MTA, METRA, and CTA budget to the calendar year, while Caltrain, SEPTA, VRE, LA Metro, WMATA, MBTA, and BART budget from July 1 to June 30. None of the budgets we accessed aligned with the federal fiscal year (October 1 to September 30). The different calendars make cross-agency budget to budget comparisons much more challenging.
Second, the agencies that are projecting budgets several years into the future are coming to widely varying conclusions based on their assumptions.
While long-term budgets help provide a window into the future, how reliable they will be is not yet clear. Agencies develop models that predict ridership, inflation, state of good repair needs, and service offerings to base their official financial forecasts on. A few agencies are predicting that they will reach their fiscal cliff soon.
Financial documents for BART use 3 ridership models: the base scenario, the downside scenario, and the upside scenario, with the base case residing in the middle, serving as the median of the predictions on which the budget forecast relies. Their base case prediction results in a $118 million annual deficit (in a $1.1 billion budget) starting in their fiscal year ending June 30, 2026. The deficit fluctuates slightly in the years following but settles out to a $140 million annual operating deficit for FY30-FY32 (including assumptions about growing operational costs).
The BART upside scenario predicts no deficit after federal pandemic relief money runs out in the first few months of FY26. Alternatively, their downside scenario results in a more than $200 million annual operating deficit starting in FY25, fluctuating to almost $275 million in FY28, until settling out to about $250 for FY30 and beyond. These numbers assume that they would maintain current service levels, which are similar to those BART offered pre-pandemic. The scenarios and their assumptions are outlined below in Table 2 and Figure 1.
Table 2: BART Ridership Scenario Assumptions
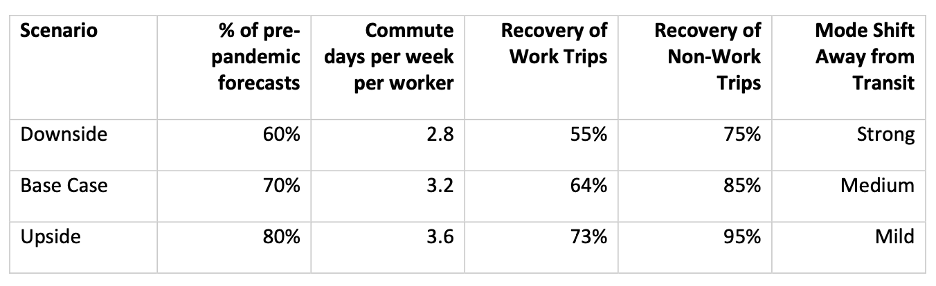
Source: BART FY23 & FY24 Preliminary Budget Memo (March 2022). See Section 2, Table 2
Figure 1: BART Operating Deficit Scenarios
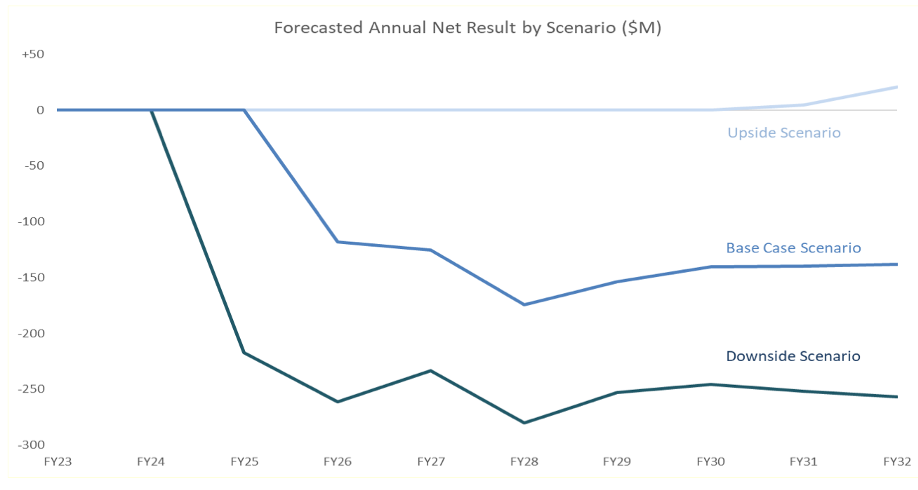
Source: BART FY23 & FY24 Preliminary Budget Memo (March 2022). See Section 2, Figure 3
The widely diverging estimates show the sensitivity of assumptions when anticipating the future; the downside annual operating deficit is about $100 million more than their base case scenario. The resulting cumulative operating deficit from BART’s downside scenario is more than double the base case scenario, just because of modest tweaks to the model assumptions. For example, a 10-percentage point change in ridership can happen in mere weeks, as occurred during the prevalence of the COVID-19 Omicron variant in January of 2022. While initially lower because of the holidays, national ridership averages (as estimated by the APTA/Transit Ridership Trends Dashboard) stayed below early December ’21 numbers for six weeks because of the increased infection communities all around the country were experiencing (BART closely mirrored these recovery trends). Ridership recovery returned to pre-omicron levels and slowly crept beyond them indicating that the future will likely be a complex combination of the three ridership models the predictions are based upon. It is important to note that BART’s deficit does not get significantly smaller over time, in part due to expected rising costs and ridership numbers that are projected to remain lower than pre-pandemic projections.
SEPTA presents one model for future ridership growth, but goes into further detail than the BART forecast about its assumptions. In addition to service and ridership, their financial prediction model takes into account changes in expenditures due to changing fuel, labor, and material costs. SEPTA is predicting a $63 million annual operating deficit starting in FY26, growing to $283 million annually by FY28. For FY23, SEPTA assumes transit and regional rail service levels of 96 and 75 percent of their pre-pandemic offerings, respectively.
While the WMATA and NYMTA financial documents do not detail their budget projection assumptions, they identify a forecasted deficit over the next several years. WMATA predicts a $185 million annual operating deficit for their fiscal year beginning July 1, 2023. This grows to an anticipated $527 million annual operating deficit by FY25, and $731 million by FY29. NYMTA predicts a $2.26 billion deficit for their 2025 operations, and a $2.33 billion deficit for their 2026 operations. These deficit numbers are after taking account for proposed toll and fare increases in the NYMTA service area.
Finally, many agencies are not publicly forecasting their budgets more than one year into the future.
Of the 10 agencies we were able to obtain budget information, six of them forecast only one year into the future. This is not to say that internally these agencies are not attempting to quantify their future budget gap, but rather that they do not feel confident enough in their forecasting to work it into their public budgets.
The Virginia Railway Express (VRE), for example, typically includes a five-year financial forecast in their budgets. They have not been included in budgets drafted since the beginning of the pandemic as “such a forecast would reflect highly uncertain estimates on many key variables, particularly ridership, and would not serve as a reliable basis for decision-making.” VRE has an approved operating budget of $97.8 million for their fiscal year ending June 30 of 2023 that is balanced with over $28 million of federal pandemic aid. While a FY24 budget is not approved, September Board minutes indicate a budget deficit of $31.8 million before accounting for remaining pandemic aid. (29 percent of their $111 million operating expenses). The minutes indicate that remaining CARES funding will be spent during FY23, at which point American Rescue Plan (ARPA) money will be drawn upon. However, without an official financial forecast, we could not calculate how much of the $31.8 million FY24 gap will be covered by their remaining ARPA funds.
Making long-term predictions in such an unpredictable, post-pandemic environment might lead agencies and policymakers to make decisions based on models that do not end up aligning with future travel demands. However, these estimates are still helpful tools, as long as there is an understanding of their variability when making long-term decisions.
Data and budget transparency will be key to understanding the funding needs of public transit into the coming years and decades. Agencies can be helpful in informing this important policy discussion by making data publicly accessible, reporting clear revenue and expense data that goes back several years, and clearly presenting the assumptions of service levels, fare structures, subsidy changes, and inflation of costs. Any anticipated federal pandemic aid money, both received and spent, needs to be clearly indicated.
We know that many agencies are facing a near-term fiscal cliff that will be difficult to address without significant cash infusions or draconian cuts to service. Agencies and national policymakers will need to be creative in finding new sources of revenues, attracting new kinds of riders, and implementing cost-saving measures. But first and foremost, good data that is accessible to policy makers will be essential as we work through the complexities and unknowns of this issue.

