May 11, 2017
Next week is Infrastructure Week here in Washington DC, a coordinated attempt to get federal policymakers and the public engaged in understanding the importance of infrastructure at all levels of government. It is also often used to raise support for proposals increasing the levels of government spending to build and maintain said infrastructure.
One year ago, in anticipation of Infrastructure Week, ETW published this article analyzing trends in federal grants to states and localities for transportation infrastructure over the last 70 years. (The Office of Management and Budget publishes historical tables back to 1940, but domestic spending was largely shut down during World War II, so we started in FY 1947.)
This article updates last year’s piece to add drinking water and sewer infrastructure grants, but also focuses on historical average spending, and how much more the U.S. needs to be spending to get back to average.
A few caveats:
- OMB only reports outlays back that far – the cash leaving the Treasury at the end of the budget process – so the year-to-year spending levels are uncontrollable, as they lag policy changes by a variable amount of time.
- This data is for grants to state and local governments only, which excludes direct federal spending like Corps of Engineers water projects and FAA air traffic control, as well as grants to Amtrak (which is neither a state nor local entity).
- The most objective way to compare government spending over many decades is as a percentage share of the economy. The one problem with this measure is that both the numerator and the denominator matter, and identical dollar amounts look like spending increases during a recession. (This is why looking at New Deal spending is problematic – GDP shrank by 30 percent and then rebounded.)
The first chart shows the big picture:
Federal Grants to State/Local Governments for Transportation and Water Infrastructure as a Percentage of US Gross Domestic Product, FY 1947-2016
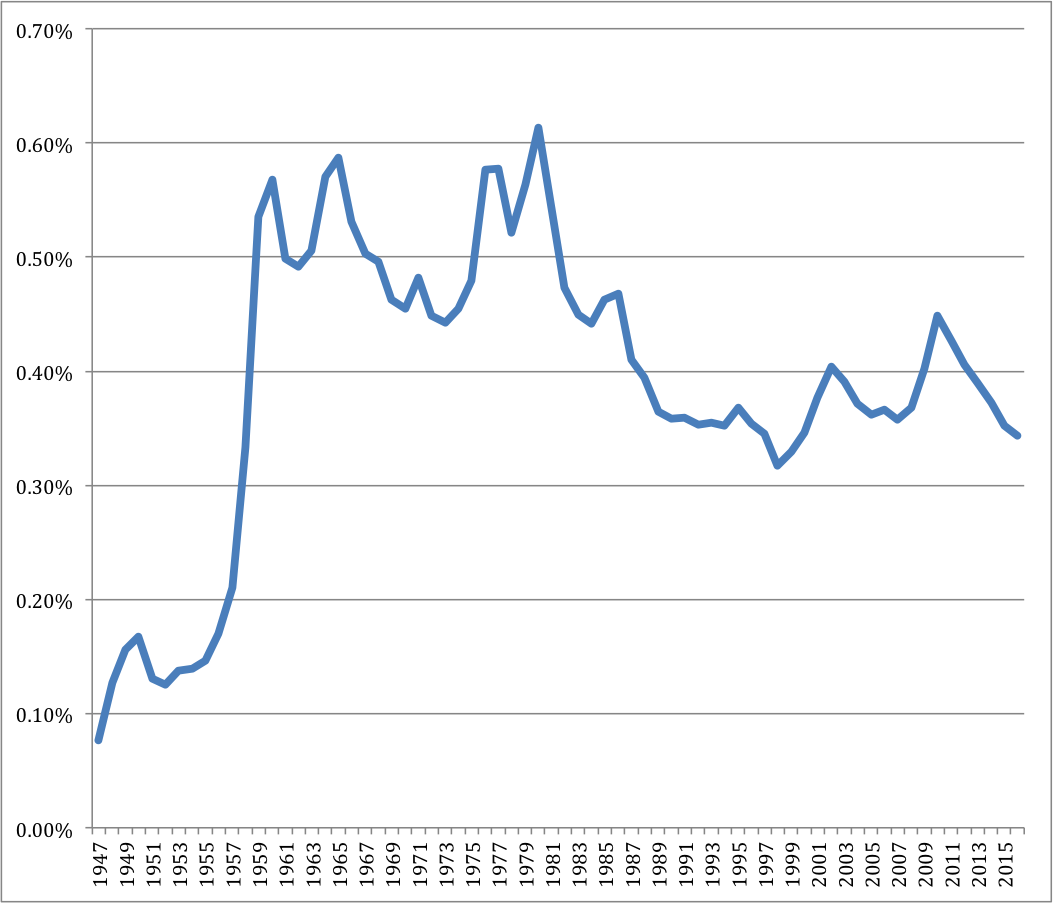
The enactment of the 1956 Interstate Highway law caused infrastructure grants as a share of GDP to triple by 1960 (aided by a short, sharp recession in that year). True peak Interstate spending was in 1965 – after that, grants to states and localities for infrastructure gradually receded as a share of the economy until Congress started creating massive new spending programs.
 The second chart, below, shows the exact same numbers as the preceding chart but breaks it down into the type of infrastructure. This clearly shows that the 1972 Clean Water Act, which provided an at-the-time staggering amount of $18 billion in general fund contract authority for sewer grants, and the 1970 and 1974 mass transit laws (also general fund contract authority), created more than enough new spending to fill the economic gap. In 1970, highway outlays were almost 15 times as large as combined water and transit outlays. By 1975, the ratio was 2 to 1, and by 1980 (the all-time high-water mark of these grants as a share of GDP) they were approaching parity.
Federal Grants to State/Local Governments for Transportation and Water Infrastructure as a Percentage of US Gross Domestic Product, FY 1947-2016, By Mode
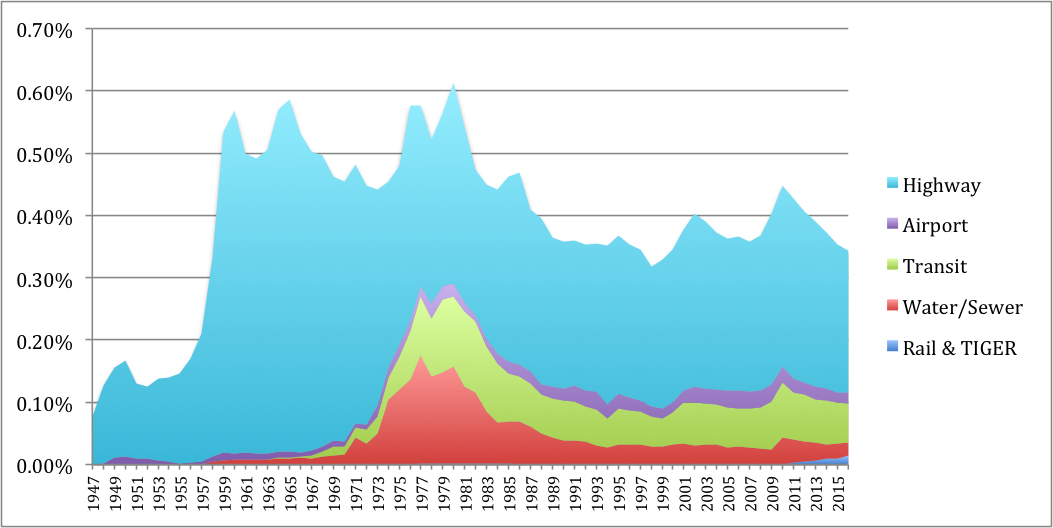
Water grants gradually receded, but this is misleading. In 1987, the Clean Water Act switched away from making sewer grants to localities and instead started using federal money to endow state revolving funds to make low-interest loans to localities (echoed in 1997 with Safe Drinking Water Act loan funds). This leveraging means that most of the total amount of federal financial assistance for water and sewer projects no longer shows up in the federal budget.
The next chart shows the same underling data as the first two, but also shows the historic average spending for three periods:
- The first 30 years of the Interstate era (FY 1957-1986), which includes both peak Interstate spending and peak water spending) – 0.495% of GDP;
- The next 30 years (FY 1987-2016) – 0.372% of GDP; and
- The full 60-year period of FY 1957-2016 (0.435% of GDP).
Federal Grants to State/Local Governments for Transportation and Water Infrastructure as a Percentage of US Gross Domestic Product, FY 1947-2016
Also Shows Averages for FY 1957-1986, FY 1987-2016, and FY 1957-2016
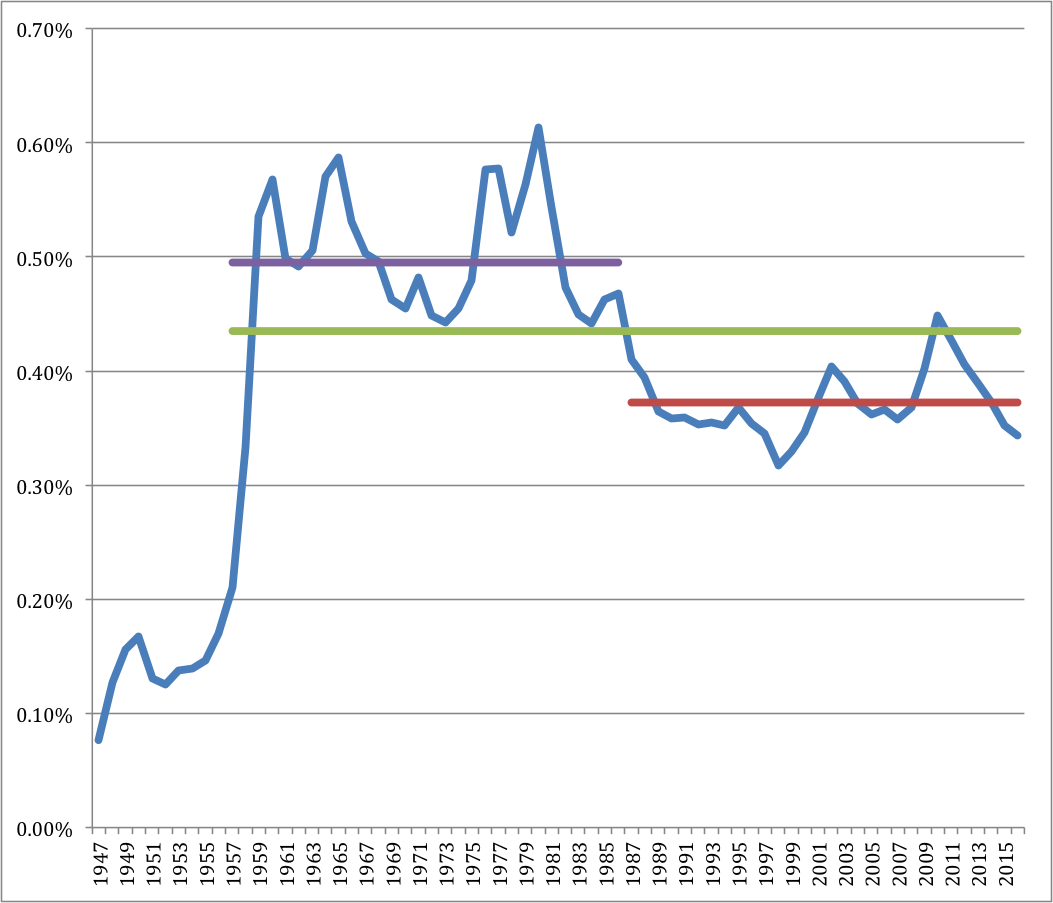
This article relies on the dataset included in last year’s federal budget because the new budget has not yet been released. As such, the FY 2016 outlays were only an estimate (as was FY 2016 GDP), but OMB’s estimate was that the grant outlays would total 0.344% of GDP, which is not that far off from the average over the last 30 years.
To put it in dollar terms, those FY 2016 grant outlays were anticipated to be $63.5 billion. How much would the federal government have to increase spending, in dollar terms, to get back to those historical average shares of GDP?
The most recent GDP data available is for calendar year 2016 – $18.689 trillion. Multiplying the historical average GDP shares by the CY 2016 total, the equivalent total spending to hit the 1957-1986 average would be $92 billion per year, the total spending to maintain the average of the last 30 years (1987-2016) would be $69 billion per year, and the total spending to maintain the average spending level of the last 60 years would be $80.7 billion per year.

In order to get back to the average spending of the last 30 years, the federal government would only have to increase spending for these grants by about $5.5 billion per year – an increase of less than 9 percent over current estimated spending levels. Getting back to the historical average over the last 60 years would require an extra $17.2 billion or so per year, a 27 percent spending increase. And getting back to the spending levels of the first 30 years of the Interstate era – a timeframe which included peak Interstate spending and the peak water and transit spending – would require an extra $28.5 billion per year, a 45 percent increase.
Of course, the shifting priorities of lawmakers over the last 60 years mean that different modes are at different places compared to their historical spending averages.
 Highway spending would have to be increased by $4.6 billion per year to get back to the average of the last 30 years and $16.3 billion per year to get back to the average of the last 60 years. (Going back to the spending rates of the peak Interstate era would be a major policy reversal – the huge spending for Interstate construction was intended by Congress to be a one-time deal, and the original plan was for maintenance of the Interstate system to be exclusively a state responsibility.)
New funding for airport grants has been stuck at between $3.3 and $3.4 billion per year, in nominal terms, for 13 years (except for one-time 2009 ARRA stimulus funding), so its share of a growing economy has decreased each year, to the point that we are now $0.8 billion per year below the average of the last 30 years.
As noted earlier, since federal support for sewer and drinking water projects has switched from grants to loan subsidies, those numbers are no longer comparable. The federal government is already spending the 1987-2016 average on mass transit (though the peak of mass transit spending as a share of GDP was actually a recession-influenced FY 1981, at 0.120%, almost twice the FY 2016 0.63%). TIGER and rail grants are an afterthought, historically speaking, and the recent rail spending levels are an anomaly that will expire after the FY 2009 ARRA and FY 2010 appropriations or high-speed rail are finally spent or expire.
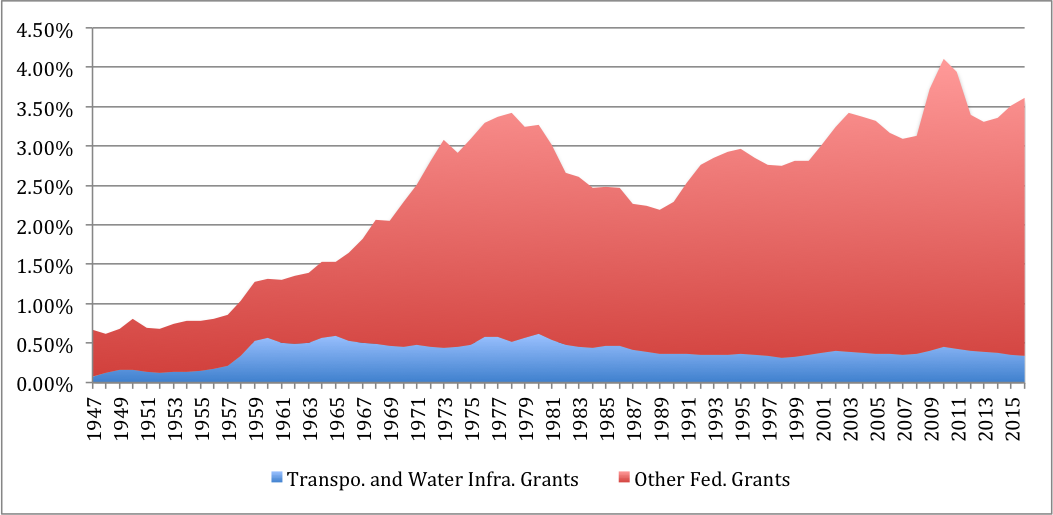
One final chart: it’s not that federal grants to state and local governments have waned over recent decades – far from it. It’s just that federal priorities have changed, starting with the Great Society, away from infrastructure grants and in favor of grants for various types of social programs. During the peak Interstate decade (1958-1967), federal spending for other grants was 1.8 times larger than spending for infrastructure grants, on average. In FY 2016, outlays for non-infrastructure grants to states and localities were 9.5 times greater than the total spending on infrastructure grants.
All Federal Grants to State/Local Governments as Percentage of US Gross Domestic Product, FY 1947-2016
Methodological notes: Spending data taken from Table 12.3 in the online-only Historical Tables volume of the FY 2017 President’s Budget. Historical GDP data taken from Table 1.2 of the same source. CY 2016 GDP data from the NBER website. Unfortunately, the OMB grant data combines mass transit operating subsidy grants with mass transit capital grants and the two cannot be separated. Likewise, the water/sewer data is for the entire EPA STAG budget account – almost all of which is for water and sewer grants, but there are other kinds of environmental infrastructure grants in there as well which cannot be separated.

