Passenger air travel, anecdotally and as measured by TSA passenger throughput, is recovering slightly in May after bottoming out in April. What kind of passenger travel recovery can we expect, and how will that affect the dire financial situation faced by the airlines?
Let’s look at what actually happened in 2019, in terms of revenue passenger-miles in scheduled service (the standard metric, because the raw number of passengers doesn’t differentiate between a passenger flying 500 miles and one flying 5,000 miles, but that difference is usually huge financially). Here are the raw (not seasonally adjusted) month-by-month RPM totals for 2019, in billions, for U.S. air carriers:
| 2019 |
Bil. RPM |
| Jan |
76.94 |
| Feb |
70.76 |
| Mar |
90.03 |
| Apr |
86.21 |
| May |
92.55 |
| Jun |
97.81 |
| Jul |
101.79 |
| Aug |
98.03 |
| Sep |
83.35 |
| Oct |
87.65 |
| Nov |
80.52 |
| Dec |
89.96 |
| TOTAL |
1,055.59 |
Then let’s look at what we know has happened so far in 2020, and what we think is in the process of happening. January and February travel was higher in 2020 than the prior year, at 81.04 and 73.89 billion RPM, respectively. Then travel demand started to deteriorate in March. The Bureau of Transportation Statistics has issued a preliminary estimate that enplanements (the number of passengers boarding planes) was down 51 percent in March 2020 versus March 2019, but international travel started suffering first, and those are much longer flights, so we are going to guesstimate that RPMs were down 55 percent in March.
Based on TSA passenger throughput data, we feel safe in saying that passenger RPMs in April 2020 were only around 5 percent of the April 2019 level. We are already starting to see an uptick in passenger throughput as more states reopen, so let’s hypothesize that the eventual total for May 2020 will improve slightly and be 10 percent of the May 2019 total.
Now, let’s assume the impossible – a miraculous and instantaneous recovery, where the world goes completely back to normal, as if coronavirus had never existed, starting on June 1, 2020. (Even if full demand showed up magically, carriers have probably already mothballed too many planes to get back to full capacity by June 1.) We only show this scenario to demonstrate how deep is the hole that March-April-May has dug for air travel:
| Scenario: Miraculous, Complete Recovery Starting June 1 |
|
2019 |
2020 |
2020 Assumptions |
| Jan |
76.94 |
81.04 |
Actual 2020 |
| Feb |
70.76 |
73.89 |
Actual 2020 |
| Mar |
90.03 |
40.51 |
45% of Mar 2019 |
| Apr |
86.21 |
4.31 |
5% of Apr 2019 |
| May |
92.55 |
9.26 |
10% of May 2019 |
| Jun |
97.81 |
97.81 |
June 2019 level |
| Jul |
101.79 |
101.79 |
July 2019 level |
| Aug |
98.03 |
98.03 |
August 2019 level |
| Sep |
83.35 |
83.35 |
Sept 2019 level |
| Oct |
87.65 |
87.65 |
Oct 2019 level |
| Nov |
80.52 |
80.52 |
Nov 2019 level |
| Dec |
89.96 |
89.96 |
Dec 2019 level |
| TOTAL |
1,055.59 |
848.11 |
|
|
|
|
|
|
|
-207.5 |
vs 2019 Total |
|
|
-19.7% |
|
Even under the miraculous scenario, RPMs would still be down about 20 percent on the year from 2019. To put this in perspective, look back to 9/11. Systemwide scheduled RPMs for U.S. carriers over the 12-month period from September 2000 to August 2001 totaled 701.1 billion and dropped to 609.6 billion in the 12-month period from September 2001 to August 2002, a decline of 13.1 percent. Even if a miraculous recovery brought demand completely back to 2019 levels starting June 1, the loss for the year would still be worse than the year after 9/11. This drop in traffic would almost certainly be the worst since World War II (though we only have data going back to 1950).
But no one thinks that things are going to pop back to normal anytime soon. Let’s look at what would be an (overly?) optimistic scenario for demand recovery, where demand in June pops back to about half of what it was last year, and then steadily creeps back to 2019 levels after Thanksgiving.
| Optimistic Scenario – Full Recovery by Dec. 1 |
|
2019 |
2020 |
2020 Assumptions |
| Jan |
76.94 |
81.04 |
Actual 2020 |
| Feb |
70.76 |
73.89 |
Actual 2020 |
| Mar |
90.03 |
40.51 |
45% of Mar 2019 |
| Apr |
86.21 |
0.22 |
5% of Apr 2019 |
| May |
92.55 |
0.93 |
10% of May 2019 |
| Jun |
97.81 |
48.91 |
50% of June 2019 |
| Jul |
101.79 |
61.08 |
60% of July 2019 |
| Aug |
98.03 |
68.62 |
70% of August 2019 |
| Sep |
83.35 |
66.68 |
80% of Sept 2019 |
| Oct |
87.65 |
78.88 |
90% of Oct 2019 |
| Nov |
80.52 |
76.50 |
95% of Nov 2019 |
| Dec |
89.96 |
89.96 |
100% of Dec 2019 |
| TOTAL |
1,055.59 |
687.20 |
|
|
|
|
|
|
|
-368.4 |
vs 2019 Total |
|
|
-34.9% |
|
Under this optimistic recovery scenario, total passenger traffic for 2020 would still be down over one-third from 2019, a situation about two-and-a-half times worse than the annualized traffic drop after 9/11.
Now let’s look at a more realistic scenario (according to most airline industry observers). Assume that traffic jumps back to 35 percent of the 2019 level in June and then creeps steadily upwards so that in December, traffic is 70 percent of the 2019 level. The actual recovery may be better than this, but it would not be shocking if the actual recovery is not quite this good, either. Those numbers would look like so:
| Scenario: 70% Recovery by End of Year |
|
2019 |
2020 |
2020 Assumptions |
| Jan |
76.94 |
81.04 |
Actual 2020 |
| Feb |
70.76 |
73.89 |
Actual 2020 |
| Mar |
90.03 |
40.51 |
45% of Mar 2019 |
| Apr |
86.21 |
4.31 |
5% of Apr 2019 |
| May |
92.55 |
9.26 |
10% of May 2019 |
| Jun |
97.81 |
34.23 |
35% of June 2019 |
| Jul |
101.79 |
40.72 |
40% of July 2019 |
| Aug |
98.03 |
44.11 |
45% of August 2019 |
| Sep |
83.35 |
41.67 |
50% of Sept. 2019 |
| Oct |
87.65 |
48.21 |
55% of Oct. 2019 |
| Nov |
80.52 |
52.34 |
65% of Nov. 2019 |
| Dec |
89.96 |
62.97 |
70% of Dec. 2019 |
| TOTAL |
1,055.59 |
533.26 |
|
|
|
|
|
|
|
-522.33 |
vs 2019 Total |
|
|
-49.5% |
|
Under this scenario, total passenger traffic on U.S. airlines for the whole of 2020 would be cut in half from last year’s actual total.
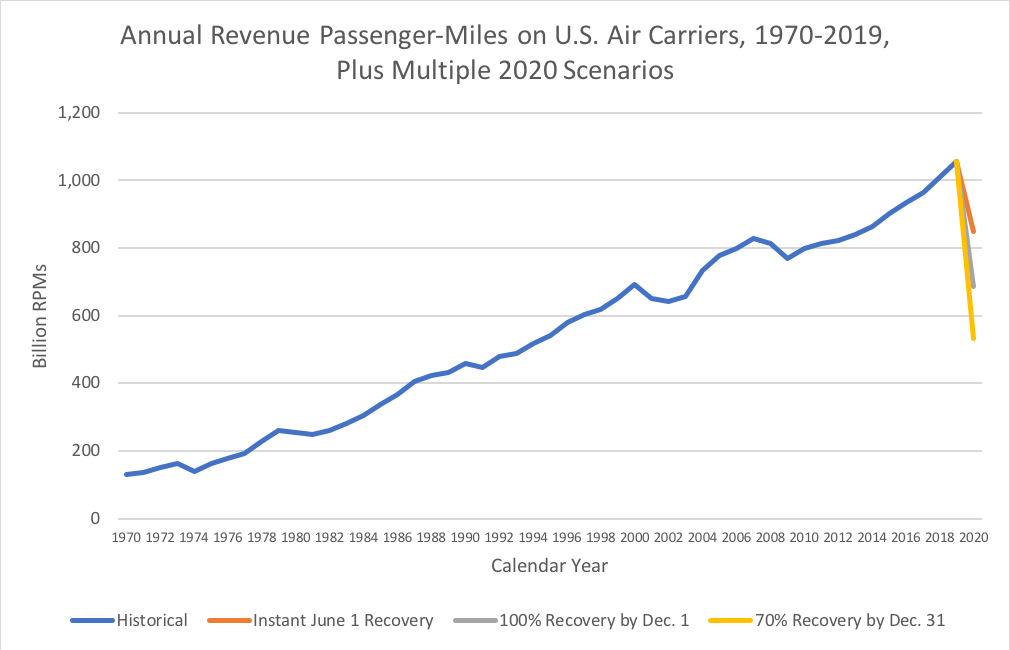
We graphed these three 2020 scenarios out in the context of annual scheduled revenue passenger-miles since 1950, then we truncated the x-axis to a starting point of 1970 so that you could see a bit more of the difference between the three different 2020 scenarios, in their varying degrees of drastic drop:
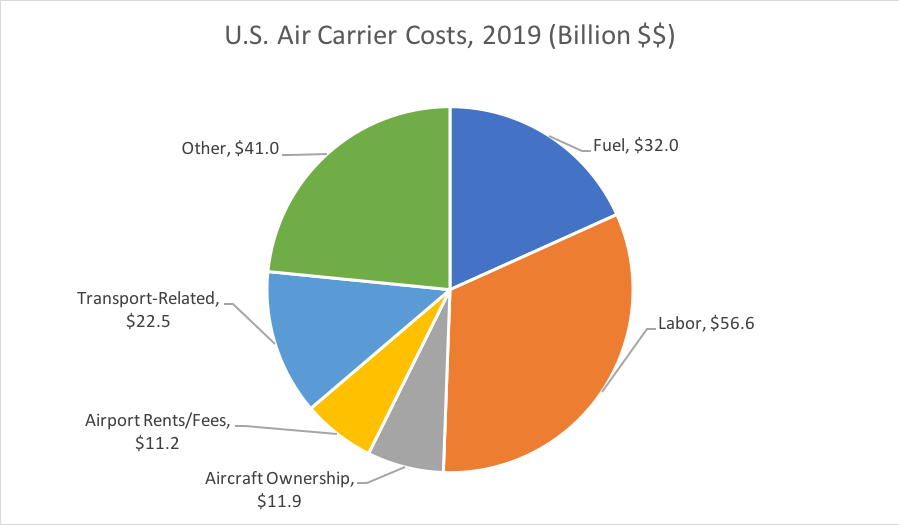
How will this affect the bottom line of the airlines? That depends on a variety of factors on the cost side. Airlines for America reports that U.S. airlines had a little over $175 billion in operating costs in 2019, which break down as follows:
The federal government has – temporarily – taken over some of the labor costs through the Payroll Support Program at the Treasury Department, which has (as of May 19) given $12.5 billion in cash to air carriers, on the way to an estimated $25 billion just for passenger air carriers to continue to pay worker salaries through September 30. Some of that money, given to larger carriers, will have to be repaid (and Treasury holds temporary stock warrants until those notes are repaid). The following is the current Treasury estimate for how much money will be given to carriers large enough to require some portion of repayment:
| Carrier |
Total Anticipated Payroll Support |
Total Anticipated Note Principal |
|
| American |
$5,814,546,440 |
$1,714,354,932 |
29.5% |
| Delta |
$5,436,331,186 |
$1,600,899,356 |
29.4% |
| United |
$4,958,498,096 |
$1,457,549,429 |
29.4% |
| Southwest |
$3,259,181,720 |
$947,754,516 |
29.1% |
| Alaska |
$992,189,880 |
$267,656,964 |
27.0% |
| JetBlue |
$935,754,826 |
$250,726,448 |
26.8% |
| Skywest |
$438,021,524 |
$101,406,457 |
23.2% |
| Spirit |
$334,736,832 |
$70,421,050 |
21.0% |
| Hawaiian |
$292,459,908 |
$57,737,973 |
19.7% |
| Republic |
$205,986,653 |
$31,795,996 |
15.4% |
| Frontier |
$204,877,426 |
$31,463,228 |
15.4% |
| Allegiant |
$171,912,904 |
$21,573,871 |
12.5% |
| ExpressJet |
$109,883,959 |
$2,430,959 |
2.2% |
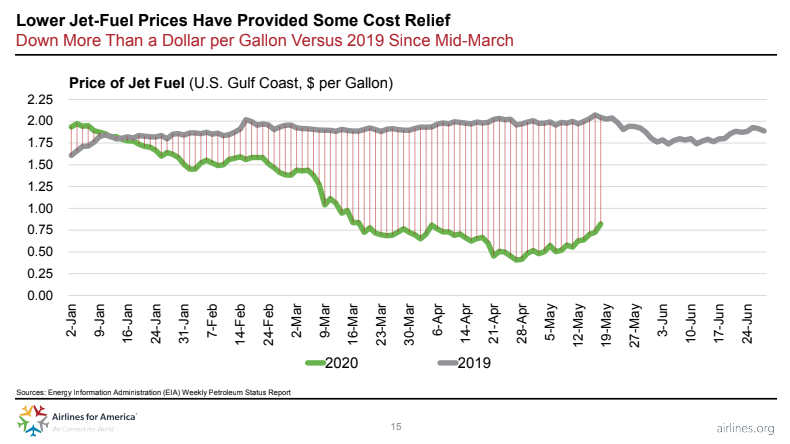
In addition, the second-biggest cost center for airlines is fuel, and the combination of the OPEC-Russia petroleum glut on the supply side and the COVID-related drop on the demand side for the finished product has led to prices for jet fuel plummeting to as low as 50 cents per gallon (whereas last year it averaged around $2.00 per gallon). The following slide from A4A’s daily-updated COVID-19 data slide deck shows how great the divergence from last year’s prices is:
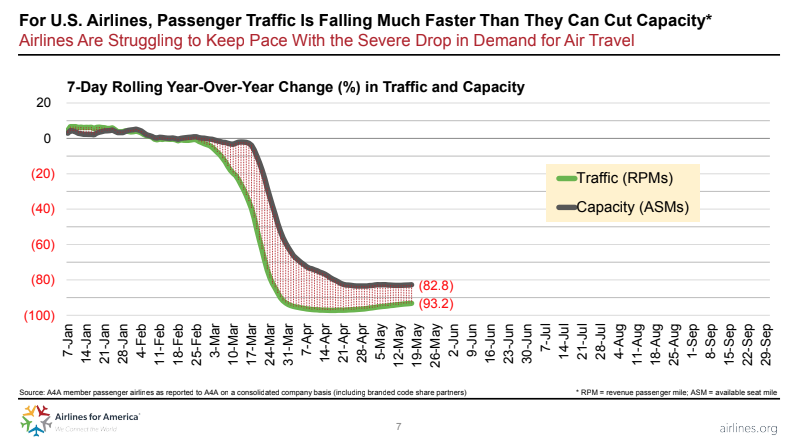
In response to the collapse in demand, airlines have cut the number of flights and parked their planes (as much as they can, given the minimum service requirements mandated by Congress as a condition of federal aid to air carriers). Also, many foreign nations have banned international flights on their end. As such, the number of available seat-miles has dropped in parallel. Again, per the A4A slide deck, as of last week, traffic in RPMs was down 93 percent from last year, while capacity for sale in ASMs was down 83 percent:
Moving forward, as demand for air travel increases, the biggest question is going to be: how full will planes be? The common measure for this is “load factor,” a percentage of RPMs divided by ASMs. The airplane equivalent of “social distancing” is not specifically defined. The most common type of aircraft layout is a single-aisle airframe with 3 + 3 seating. Leaving all middle seats vacant would imply a maximum load factor of 67 percent on that style of aircraft. There are other sizes of aircraft and different layouts – CNN had a good rundown yesterday and quoted the International Air Transport Association as saying “social distancing would mean using a maximum of 62% of seats fleet-wide.”
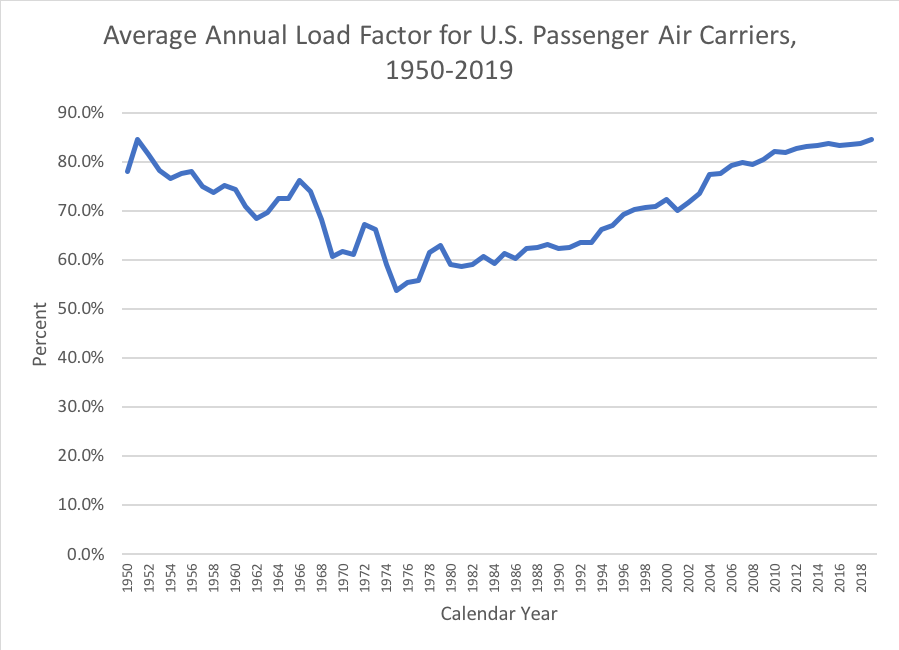
If that kind of average load factor is maintained for any length of time, it will require a fundamentally different business model than the airlines have been using. The postwar expansion of civil aviation kept driving the average load factor downwards, and this was accelerated by the conversion from props to jets starting in the early 1960s, and then the introduction of the massive 747 in 1970. But starting with deregulation in the early 1980s, average load factors steadily rose (with a divot after 9/11 and a flat year during the financial crisis) from around 60 percent to last year’s average 84.6 percent, which is tied with the 1951 high which was the highest historical average we could find.
The detailed Form 41 financial filings that U.S. air carriers make with the Department of Transportation make it possible to calculate the financial “breakeven load factor” (defined by BTS back in 2003 here) – basically, the average per-mile cost of providing passenger air service (passenger operating expenses divided by ASMs) divided by the average revenue they get per seat sold (passenger revenue divided by RPMs).
The breakeven load factor fluctuates, not only because costs are variable (particularly fuel), but also because airfares fluctuate as well. The breakeven load factor spiked after 9/11, not just because carriers faced some increased costs, but because in the months after 9/11 they had to drop their prices substantially to entice a wary public to fly again. Similarly, the breakeven load factor rose sharply again during the 2008-2009 financial crisis, because businesses cut their travel budgets substantially (fewer high-fare tickets) and the general public had less money to spend on leisure travel, pushing average airfares down.
The following chart shows, since 1978, the actual average load factors from the chart above (blue line), alongside the average breakeven load factor from air carrier financial reporting to DOT (red line). Whenever the red line was higher than the blue line, the industry as a whole was operating at a loss on the passenger side, and when the blue line was higher than the red line, they were operating at a collective profit.
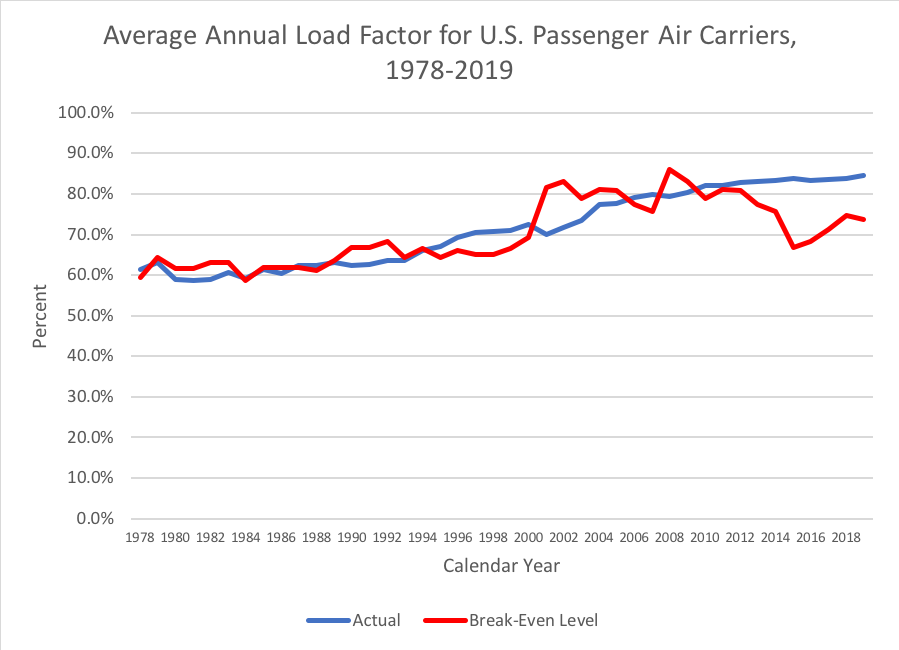 In 2019, the systemwide breakeven load factor was 73.8 percent, and the actual load factor was 84.6 percent, so the industry as a whole posted healthy operating profits ($20.9 billion). Because of coronavirus, the breakeven load factor for the industry at this moment is said to be over 100 percent (as it was in the weeks after 9/11, because of rock-bottom fares that still can’t entice people to fly on planes that are largely empty). (Reminder: these measures only apply to the capacity offered for sale at this time – all the flights that are canceled don’t count towards ASMs so they don’t count towards load factors.)
Looking back at the chart above, and extrapolating to the months ahead as things reopen, that red line for the breakeven load factor will probably jump up at least to the 2002 level of 84.2 percent, if not higher, while (as mentioned earlier), social distancing could prevent the blue line from rising above the mid-60s until we get a coronavirus vaccine or at least a far, far better public testing regimen.
As mentioned above, the way to get the breakeven load factor down is either to cut costs or increase fares (or both), but on the sales side, there is a limit to what nervous customers will pay, and antitrust laws generally prohibit airlines from coordinating fare increases, even to allow for hypothetical mandatory social distancing on airplanes. And even though the drop in fuel prices will provide some relief on the expense side, once the federal payroll grants run out (and once their restrictions on employee layoffs expire on September 30), the cost-cutting on the expense side is likely to get much worse.
