How Much Will the Infrastructure Bill Really Add to the Deficit?
When the nonpartisan Congressional Budget Office scored the bipartisan infrastructure bill that President Biden signed into law this week, their estimate said that enactment of the bill “would add $256 billion to projected deficits over that period.” But, due to limitations in CBO’s methodology, the real deficit increase from the higher spending levels in the bill will be closer to $375 billion.
CBO’s scorekeeping is limited by the fact they are required to use two completely different scorekeeping systems for two types of bills. One system is used for bills that affect revenues and/or “direct spending,” and the other is used for annual and supplemental appropriations bills (called “discretionary spending”).
This poses a specific problem for Highway Trust Fund programs, because they (along with the Airport Improvement Program) are the only programs in the entire federal government that, through a weird historical loophole, are classified as being both direct spending and discretionary spending. (The contract authority is provided by authorization laws and is considered direct spending, but the outlays from the Treasury when that authority is spent – which determine deficit impact – are classified as discretionary because the Appropriations Committees hold an annual veto over the totals.)
Table 2 in the CBO score shows that the bill increases contract authority out of the Trust Fund by $89 billion over the five-year period covered by the bill, and that those higher levels would then set the spending baseline for the Trust Fund at a level $107 billion higher for the five years after that. As acknowledged in the second paragraph of text on page 1 of the CBO estimate, “Over the 2022-2031 period, that total would be $196.5 billion more that the amount in CBO’s July 2021 baseline.”
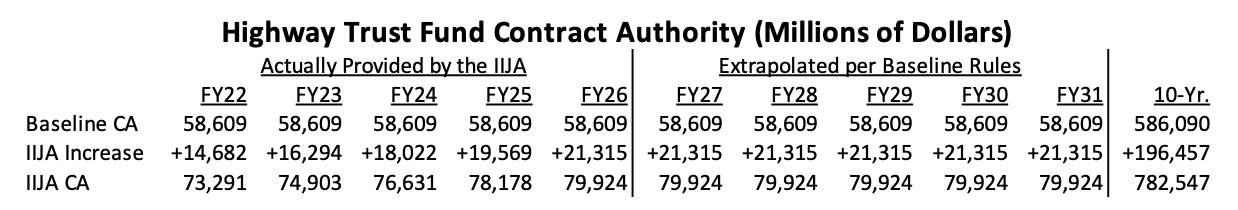
If this spending authority is to be exercised, it will increase federal spending by outlays leaving the Treasury. Yet, because of the methodology CBO is required to use, the tables used in the estimate say that the outlays from the $196 billion in increased Highway Trust Fund contract authority would be zero.
The outlays from that spending will eventually be included in the scores of the annual USDOT appropriations bills for the next decade, but those numbers are buried in the back of the committee report and no one pays attention, because the way appropriations bills are scored and controlled, outlays don’t matter anymore. (And, the way that direct spending bills are scored and controlled, budget authority doesn’t matter, only outlays. Since HTF programs have direct budget authority and discretionary outlays, they tend to avoid both types of controls, as well as usually being exempt from sequestration and spending caps and PAYGO.)
ETW has done some modeling using outlay rates as used by CBO a couple of years ago. (Highway obligations spend out at 25 percent in year 1, 41 percent in year 2, etc, and transit formula obligations spend out at 10 percent in year 1, 30 percent in year 2, etc.). Using those percentages (and some guesswork for the much smaller NHTSA and FMCSA accounts), we estimate that, of the $196.5 billion in increased contract authority identified by CBO under the IIJA, about $117.6 billion of that will be spent via outlays over the ten-year period. (Unless the Appropriations Committees decide to impose lower limits, which they have no real reason to do.)
If CBO were to publicly release its own outlay estimate, it wouldn’t be exactly $117.6 billion, but we would be surprised if it was more than $5 billion off in either direction.
Adding this estimate of the real deficit increase from the increased Highway Trust Fund spending in the IIJA puts the 10-year deficit increase close to $375 billion, as follows (all of this except for our $117.6 billion estimate is taken directly from the tables in the CBO estimate):
| Funding provided by the bill with outlays scored against the bill | ||
| 10-Yr BA | 10-Yr OT | |
| Division D – Energy | 7.5 | 7.3 |
| Division G – Other Auth. | 3.8 | 3.0 |
| Division J Appropriations | 446.3 | 415.4 |
| Subtotal, BA provided by bill with outlays scored against bill | 457.5 | 425.8 |
| Revenue Losses from PAB etc Provisions (Div. H, Title IV) | 1.2 | |
| Revenue Losses from Increased SRF Volume | 1.9 | |
| TOTAL 10-YEAR COST (GROSS) SCORED BY CBO | 428.8 | |
| Pay-Fors: | ||
| Customs User Fees | -6.2 | |
| Extend Sequestration to FY2030 and FY 2031 | -8.7 | |
| Sell Oil from SPR | -6.1 | |
| Prescription Drug Rebate Provisions | -54.0 | |
| Extend Enterprise Guarantee Fees | -21.0 | |
| Rescind COVID Appropriations | -13.4 | |
| Spectrum Auctions | -10.2 | |
| Miscellaneous | -1.3 | |
| Superfund Fees | -14.5 | |
| Other Provisions | -37.4 | |
| TOTAL PAY-FORS | -172.7 | |
| 10-YEAR DEFICIT INCREASE (NET) AS SCORED BY CBO | 256.1 | |
| Highway Trust Fund Contract Authority Increase | +196.5 | +117.6 |
| 10-YEAR DEFICIT INCREASE ACTUALLY CAUSED BY THE BILL | 373.7 | |
Coincidentally, our estimate for the increased Highway Trust Fund outlays is exactly the size of the $118 billion bailout transfer contained in the infrastructure bill, whereby the general fund transfers that amount of money to the Highway Trust Fund to try and keep it solvent for five more years. Such “intragovernmental transfers” do not score as new spending because, it is said, the outlays to be enabled by such transfers are already included in the baseline, and the cardinal sin of budget scorekeeping is counting the same dollar twice on the same side of the ledger. But, the fact that bailout transfers are not scored is actually an argument why the (currently invisible) increased outlays from contract authority increases should be scored, or should at least be made more visible in CBO estimates.
