How Much Could Inflation Erode IIJA Buying Power?
Anyone who goes to a store, a restaurant, or a gas station can see that prices are going up, and most things cost measurably more than they did a year or two ago.
Of course, that equation is easily inverted. If the price of something goes up, then the amount of that something that can be purchased with a fixed amount of money goes down. For example, gasoline prices have gone from $2.89 a gallon to $4.13 per gallon in the last year (AAA national average). On the inverted side, that means that a year ago, $50 would purchase 17.3 gallons of gasoline, but now, $50 only buys 12.1 gallons. (Depending on the size of your vehicle, the price of a full tank may of gas have crossed the $50 barrier in the last year.)
This applies not only to individual consumers but to the government as well. For infrastructure programs, the buying power of each $1 million in infrastructure funding diminishes as the prices of gravel, steel, asphalt, cement, heavy equipment, and organized labor go up.
For a historical example, look at the middle of The Great Inflation – the 1970s. Back then, the Federal Highway Administration would publish quarterly updates of the prices of major highway construction components and then weight and average them into a central Bid Price Index (BPI) as an inflation measure. During the 1970-1980 period, the cost of these highway construction components usually rose at a faster rate than did general consumer inflation (measured by the Consumer Price Index for Urban consumers).
Meanwhile, capital spending on highways by federal, state and local governments rose most years, but at a much slower rate.
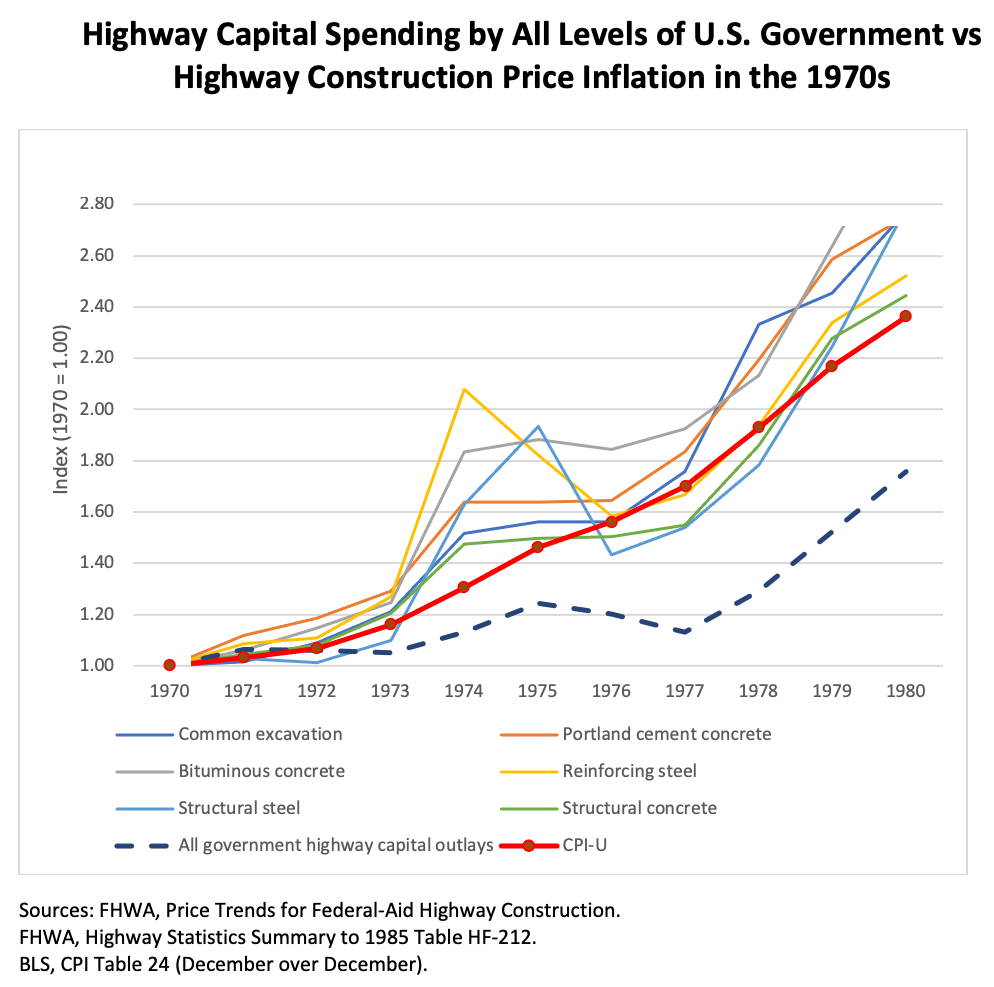
The result was that at the end of the decade, average highway construction price components were between 2.4 and 2.7 times higher than they had been in 1970. But highway capital spending was only 1.75 times higher than it had been in 1970, so in real terms, the amount of infrastructure being built managed to decrease in the 1970s, despite nominal capital spending rising by 75 percent.
The Great Inflation of 1967-1982 was a singular event, and it took the Federal Reserve raising interest rates to crushing levels, causing a devastating economic recession, to finally kill it off. (The Fed raised the Federal Funds rate, at which the Fed makes overnight loans to member banks, to 19.1 percent in 1981. The rate on the 10-year Treasury went as high as 15 percent that year. The average 30-year fixed mortgage rate peaked at 18.6 percent that year.)
But the Fed’s strategy was successful, and inflation stayed down to more manageable and less noticeable levels since then, with the Fed eventually setting a 2 percent per year inflation target.
But while inflation as felt by the consumer stayed low, the specific costs of highway construction components (not reflected in CPI) often rose at significantly greater rates.
FHWA changed its methodology, getting rid of the old BPI and switching to a new, different National Highway Construction Cost Index (NHCCI) starting in 2003. For the January-March quarter of 2003, the new NHCCI was rebased at 1.00. The most recent update is for the third quarter of 2021 (July-September), and the NHCCI had risen to 2.09, meaning that highway construction costs have more than doubled during that time.
Meanwhile, the three-month average of CPI-U was 183.0 in the first three months of 2003 and the three-month average for July-September 2021 was 273.6, meaning that regular consumer inflation only rose 49.5 percent during the same time that highway construction cost inflation went up 109 percent.
The cost inflation rate was not steady during this time, but nor were increases in highway capital spending. This chart shows total highway spending by all levels of government (from the Census Bureau this time, which reports monthly estimates that can be converted to quarters to compare with the NHCCI) versus the NHCCI from the beginning of 2003 to the third quarter of 2021.
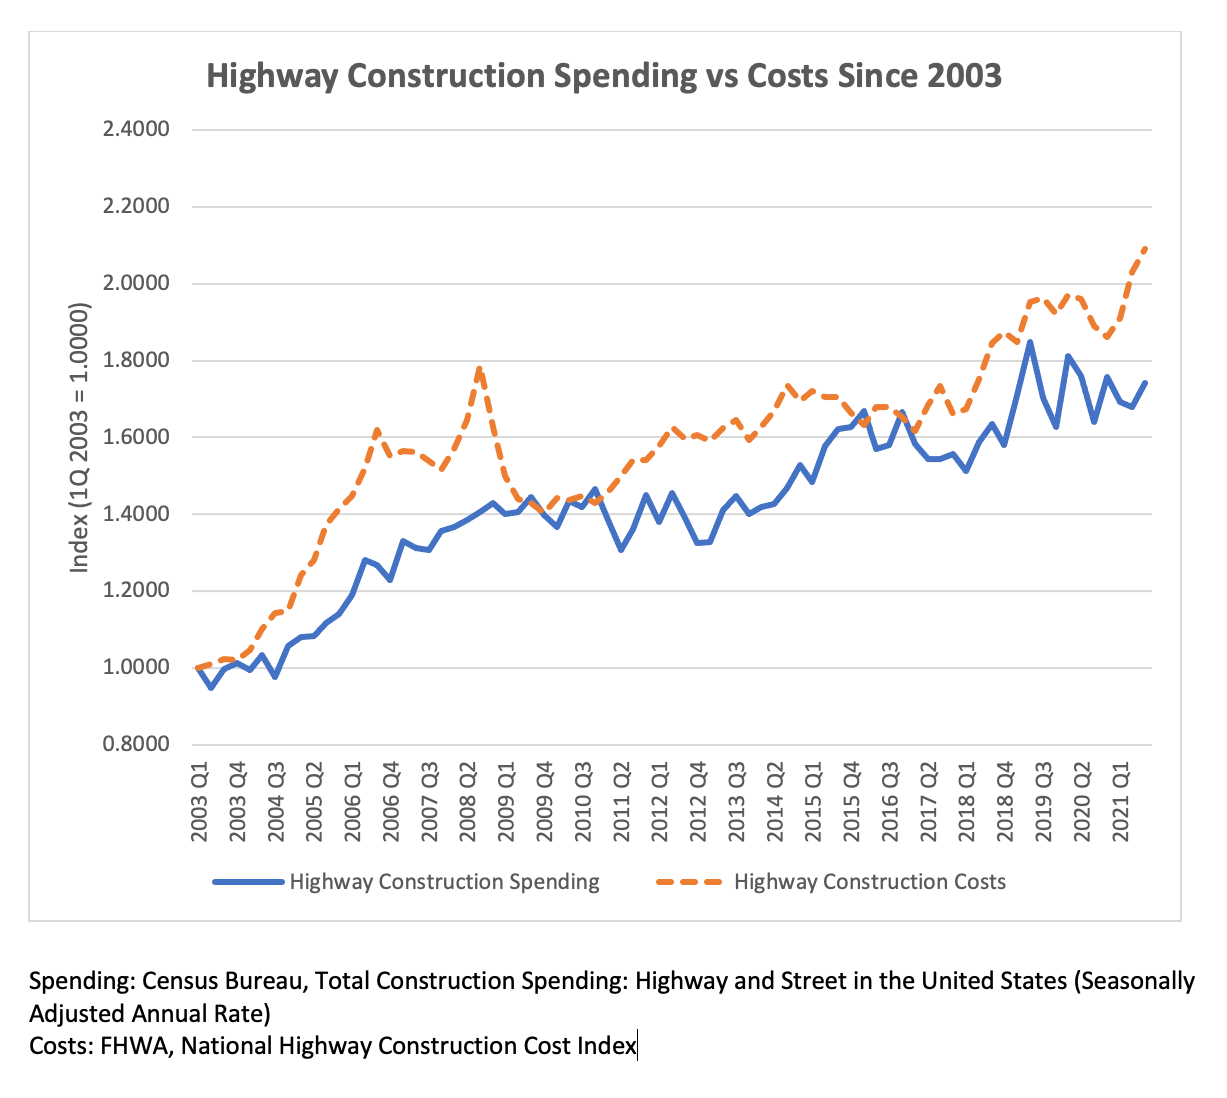
You can see that even as Congress was drafting what later became the SAFETEA-LU law in 2003, construction costs had already begun to skyrocket (some of which was prompted by China’s entry into the World Trade Organization and their resulting construction spree). The significant spending increase under SAFETEA-LU that started after the bill was signed into law in summer 2005 was more than eaten up by cost increases, meaning that “real” highway capital spending was going down under SAFETEA-LU, not up – until the global economic crash reduced commodity demand to the point that construction prices intersected with spending once again in 2009.
The two lines have caught up to each other once or twice since then, but costs have always risen just ahead of spending. The last time that the two lines crossed was the fourth quarter of 2016, when the NHCCI was 1.6534 and our corresponding index of total government highway funding (where actual January-March 2003 spending of $173.5 billion was based to 1.0000) was 1.6668 – just 1.3 percent apart.
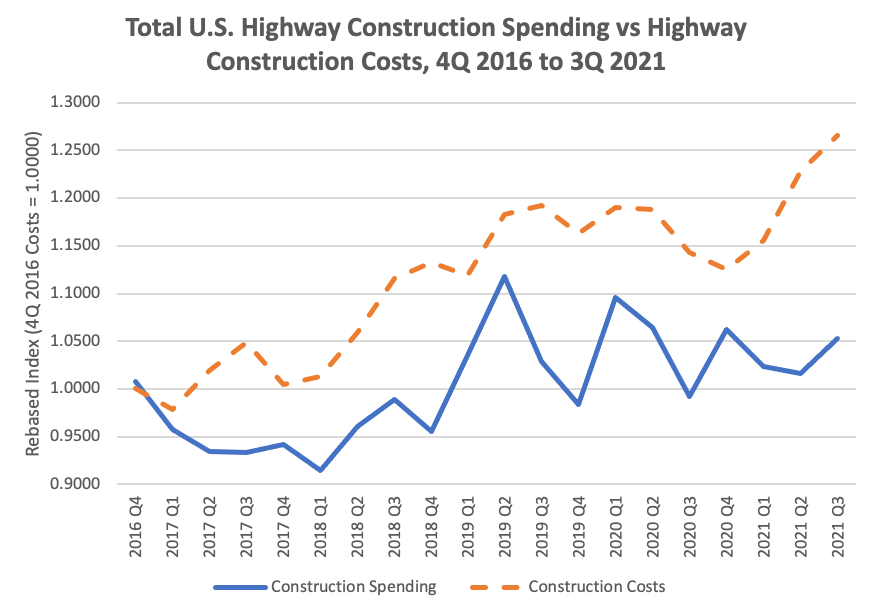
This gives an opportunity to look at the last five years in closer detail. We rebased both the spending level and the NHCCI so that the fourth quarter of 2016 was 1.0000 for the cost index and 1.0081 for the spending index.
Spending: Census Bureau, Total Construction Spending: Highway and Street in the United States (Seasonally Adjusted Annual Rate)
Costs: FHWA, National Highway Construction Cost Index
When compared to costs, total U.S. spending on highway construction still lagged behind during the entirety of the FAST Act period. And the rate of cost increase since 2020 is extremely worrisome.
What about the bipartisan infrastructure law? The IIJA was supposed to inject a massive “once in a generation” infusion of money into infrastructure across all modes, especially highways. Here is where we have to shift from past data to future forecasts. We don’t have any forecasts for state or local spending, but we do have projected outlays on highway spending at the federal level from the President’s budget for 2023, which includes all the IIJA funding.
The budget data is not available monthly or quarterly, so we have to convert to fiscal years. Using FY 2021’s $48.678 billion in outlays as a baseline, spending is projected to rise 8.6 percent in 2022, another 16.1 percent in 2023, plus 6.1 percent in 2024, another 3.3 percent in 2025 and 2.8 percent in 2026, the last year of the authorizations provided by the bill. Because of the delayed nature of outlays, they would increase another 1.2 percent in fiscal 2027 before dropping in 2028 with the post-IIJA hangover.
That growth rate makes for a mighty impressive chart:

But this impressive-looking growth rate in spending has to be compared to growth in construction costs. Here are three different scenarios: cost inflation rates of 2 percent per year (the old Fed target for consumer inflation, and we have seen that highway cost inflation tends to be higher than consumer inflation most of the time), 4.5 percent per year, and 7 percent per year. These go through the high-water mark of spending in FY 2027.
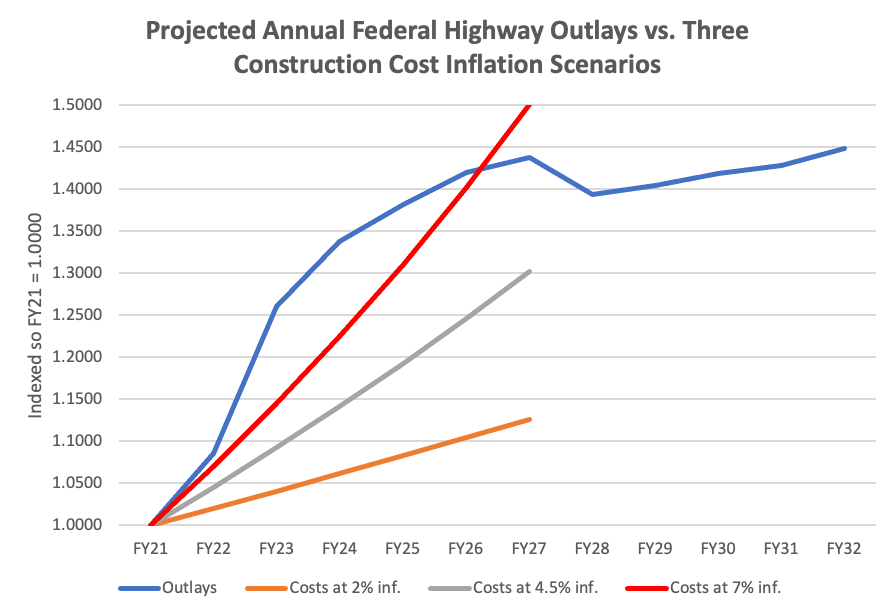
Looking at the IIJA period as being six years (2022-2027) rather than five because 2027 is the year of peak outlays, the 6-year IIJA highway outlay total in the Budget ($385.7 billion) is $92.3 billion higher than the total you would get by simply multiplying the FY 2021 total ($48.9 billion) times six for a flat-line baseline.
Under 2 percent annual highway cost inflation, $19.8 billion of that $92.3 billion increase will be eaten up by higher costs.
Under 4.5 percent annual highway cost inflation, an additional $28.5 billion of the increase will be eaten up by higher costs, for a total of $48.3 billion of the $92.3 billion increase being negated.
Under 7.0 percent annual highway cost inflation, an additional $30.9 billion of the increase will be eaten up by higher costs, meaning that the $92.3 billion IIJA increase vs flat-line costs is reduced to just $13.1 billion in “real” spending increase over a flat-line, or about $2.2 billion per year.
| FY 2021 outlays were: | $48,896 |
| x 6 = flat-line 6-year baseline: | $293,376 |
| +$19,832 | |
| Flat-line plus 2% annual inflation | $313,208 |
| +$28,470 | |
| Flat-line plus 4.5% annual inflation | $341,678 |
| +$30,904 | |
| Flat-line plus 7% annual inflation | $372,582 |
| +$13,099 | |
| Estimated 6-year outlays in Budget | $385,681 |
![]() If sustained highway cost inflation averages any higher than 7 percent per year, then inflation will have eaten the entire IIJA spending increase.
If sustained highway cost inflation averages any higher than 7 percent per year, then inflation will have eaten the entire IIJA spending increase.

