Highway Construction Costs Jumped At Least 7.3 Percent in 2021
The Federal Highway Administration this week released the last highway construction cost inflation data for calendar year 2021, and the 12-month average of the National Highway Cost Construction Index (NHCCI) was 7.3 percent higher than the 12-month average for calendar year 2020.
A 7.3 percent per year sustained cost increase has the potential to be devastating – the President’s Budget projects that federal highway spending under the Infrastructure Investment and Jobs Act will peak in fiscal 2027 at $70.0 billion in outlays, which is a 43.7 percent increase over fiscal 2021’s $48.7 billion. 43.7 divided by 6 equals an average annual federal highway spending increase of – wait for it – a little under 7.3 percent per year. So, 7.3 percent cost inflation per year, sustained for six years, would eat up the entire IIJA highway funding increase.
But there is reason to believe that the true story told by the 4th quarter 2021 NHCCI numbers is actually worse than that. To begin with, any year-long comparison versus 2020 is going to be a bit misleading because of the unique nature of the COVID recession of that year. (So, even though the 4th quarter 2021 NHCCI is 17.5 percent higher than the 4th quarter 2020 number, take that with a grain of salt.)
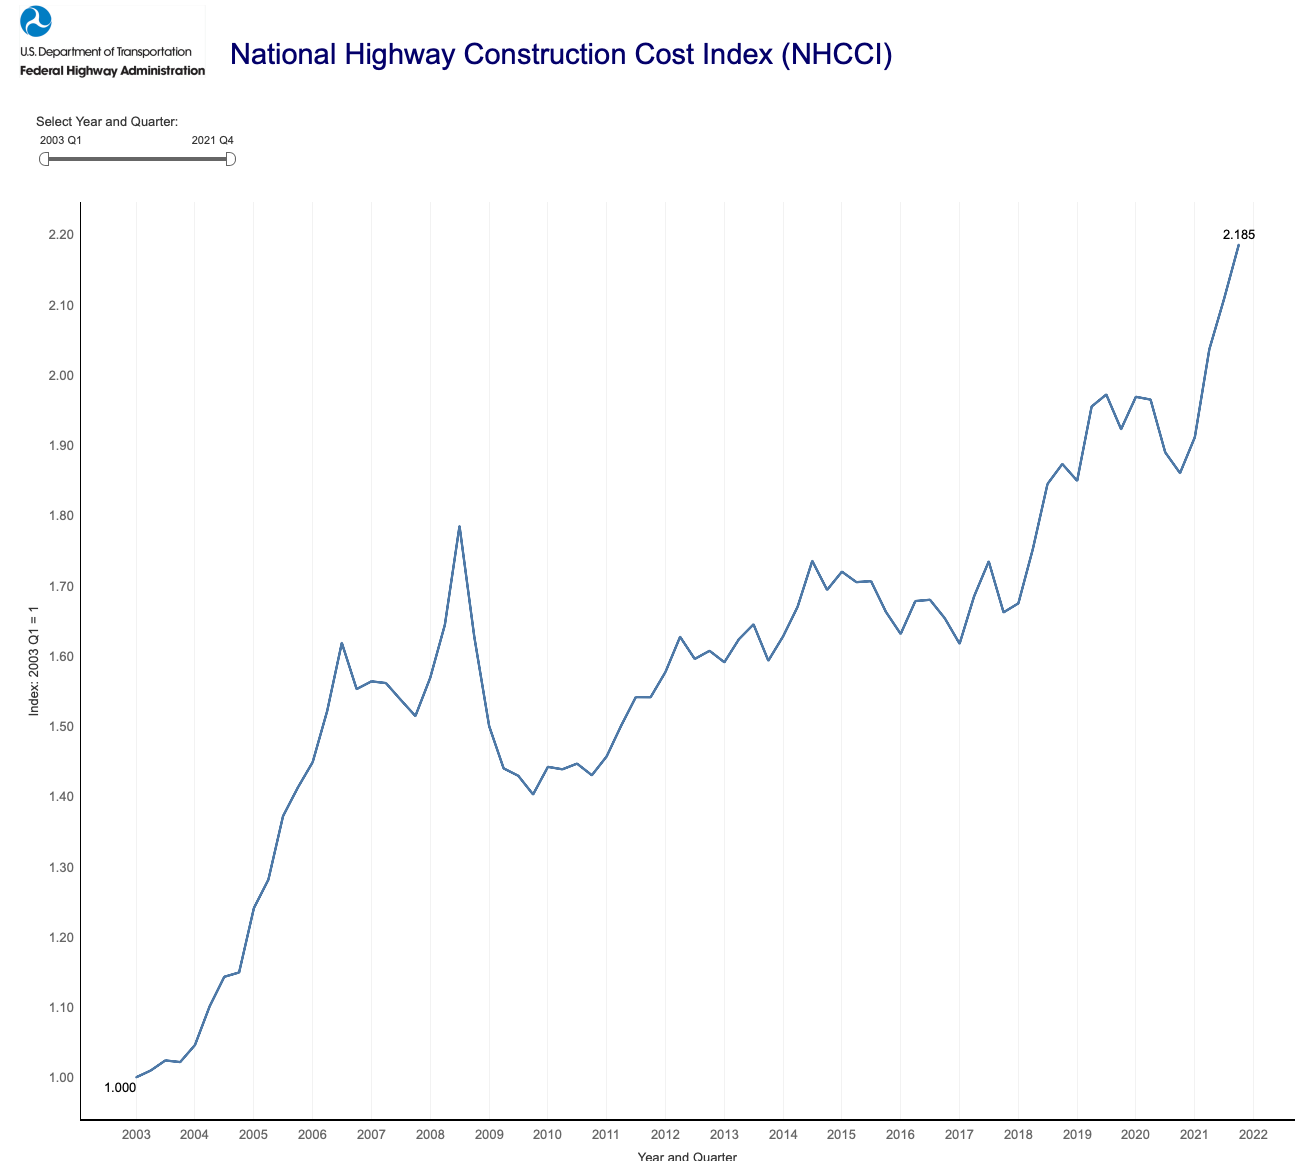
But, countering that, inflation didn’t really take off until the second half of 2021. Another way to look at inflation is in consecutive quarters. The 4th quarter 2021 NHCCI of 2.185 was 3.6 percent higher than the 3rd quarter 2021 index of 2.11. 3.6 times 4 equals an annual inflation rate of 14.2 percent. So, if the trends in the 4th quarter of 2021 are extrapolated, highway cost inflation in 2022 will be a lot closer to 14.2 percent per year than it will be to 7.3 percent per year.
A breakdown of the NHCCI components reveals that, unsurprisingly, increases in the cost of asphalt were the largest cost driver of the 4Q2021 cost inflation. The price of asphalt is tied directly to the price of a barrel of crude oil, which skyrocketed, so asphalt by itself represents about 40 percent of the 4th quarter cost increase. The next largest component of the cost increase is the cost of bridge work (all facets of which are lumped together into one category by FHWA), and the biggest driver of bridge cost is structural steel. Bridges were an additional 20 percent of the 4th quarter cost increase.
Worst-case scenario? Look to the 1970s. Here are the annual average totals for the Federal Highway Administration’s old Bid Price Index (since replaced by NHCCI) for that decade.
| Highway Construction Costs in the 1970s | ||
| 1967 base | ||
| CY | BPI | Annual ∆ |
| 1970 | 124.9 | |
| 1971 | 130.8 | +4.7% |
| 1972 | 138.4 | +5.8% |
| 1973 | 152.4 | +10.1% |
| 1974 | 202 | +32.5% |
| 1975 | 203.9 | +0.9% |
| 1976 | 199.4 | -2.2% |
| 1977 | 216.4 | +8.5% |
| 1978 | 264.7 | +22.3% |
| 1979 | 308.4 | +16.5% |
At the end of the decade, the 1979 BPI average of 308.4 was 147 percent above what the 1970 annual average had been, for an annual average increase of 14.7 percent per year in the BPI over a decade, even though most of the inflation was around two big jumps, the OPEC oil embargo that started in late 1973 and then the overall double-digit surge of 1978 that then got exacerbated by the oil price shock from the Iranian revolution shutting down oil production starting in November 1978.

