Highway Construction Costs Have Risen 50% in Two Years

The Federal Highway Administration recently released its updated index of highway construction costs for the July-September 2022 quarter, and it shows that inflation in this sector is more extreme than in the general economy – construction costs have increased 50 percent since December 2020.

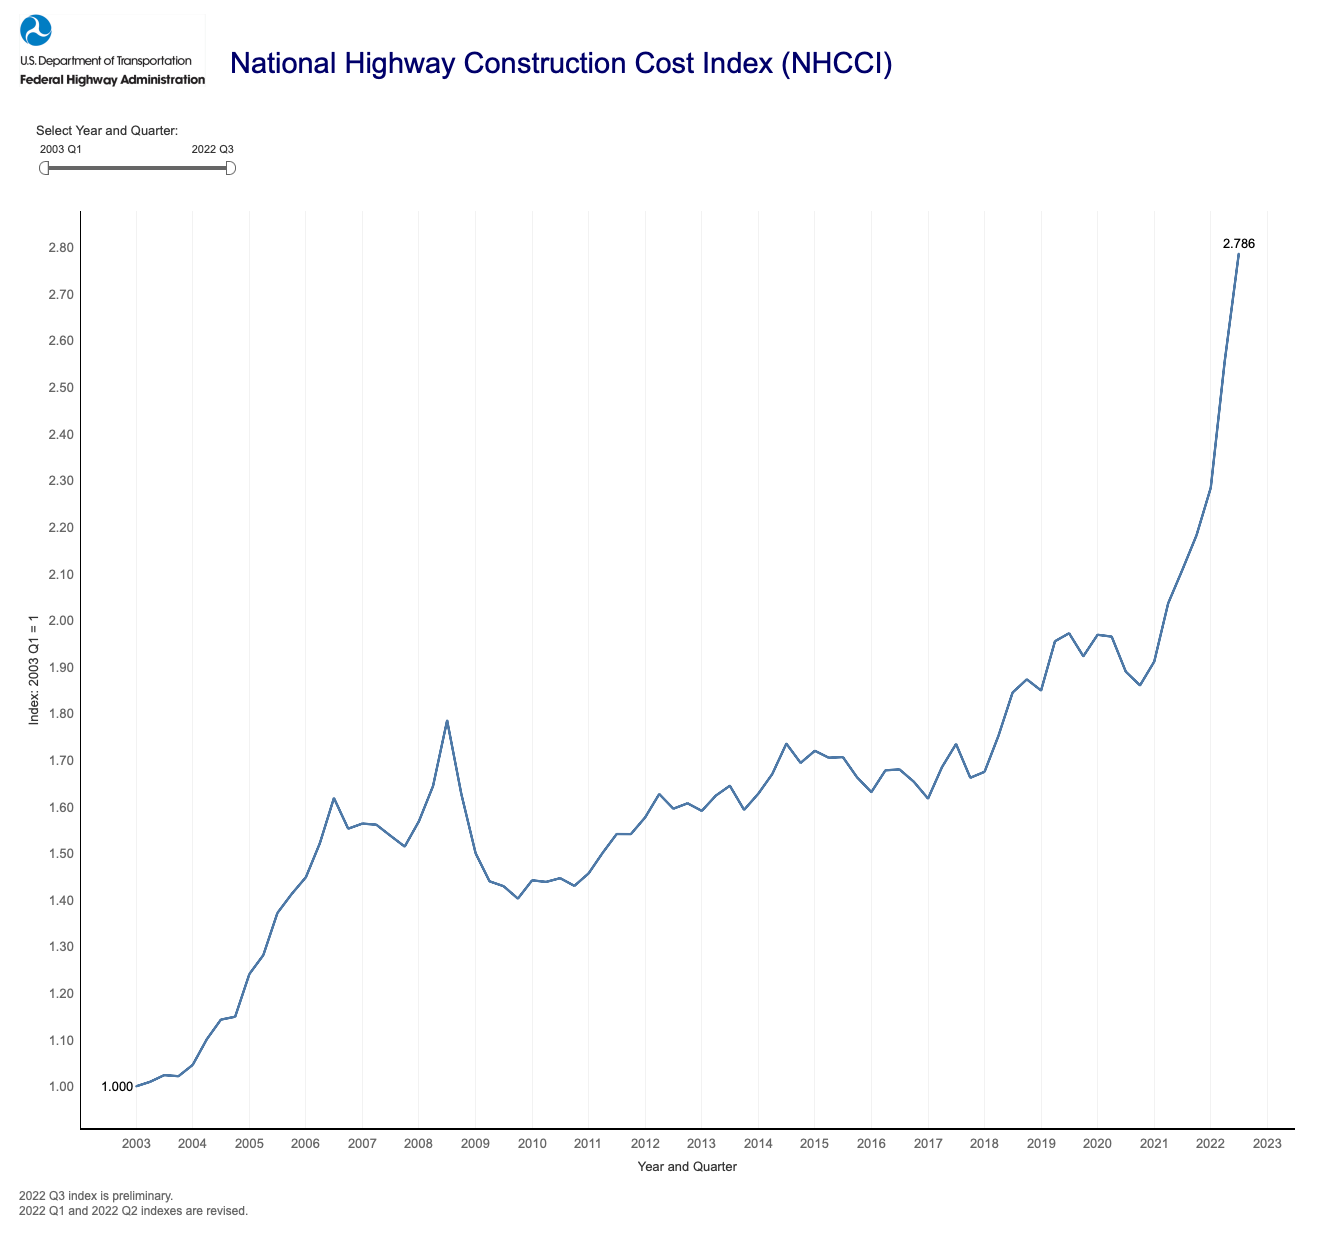
FHWA started estimating the National Highway Construction Cost Index (NHCCI) in 2003 and the updated graph is ugly indeed:

The NHCCI started in the third quarter of 2003, based at an even 1.0000 and the third quarter 2022 index was 2.7862 which means that highway construction cost almost 2.8 times as much in summer-fall 2023 as it did 20 years prior. But the chart shows two great inflation runs: 2004-2006, fueled by a doubling of oil prices and by China’s entry into the WTO (and the effect that had on the world demand for construction materials), and the present run which started at the beginning of 2021.

The last low point of the index before the current run was the 4th quarter of calendar 2020, which was the first quarter of federal fiscal year 2021. Here is the index starting then:

Quarter NHCCI Increase
Oct.-Dec. 2020 1.8601
Jan.-Mar. 2021 1.9112 +2.7%
Apr.-Jun. 2021 2.0363 +6.5%
Jul.-Sep. 2021 2.1075 +3.5%
Oct.-Dec. 2021 2.1821 +3.5%
Jan.-Mar. 2022 2.2841 +4.7%
Apr.-Jun. 2022 2.5552 +11.9%
Jul-Sep. 2022 2.7862 +9.0%
3Q CY22 Over 4Q CY20 +49.8%

Of the 9.0 percent increase, quarter over quarter, FHWA estimates that 3.5 points of it is from increases in the price of asphalt, which is mostly based on the price of crude oil. The next biggest component of the increase was grading and excavation, which is heavily dependent on the price of the diesel fuel burned by the earthmoving equipment. But one-sixth of the 9 percent cost increase was the bridge category, which is mostly steel, the cost of which is mostly independent of oil prices.

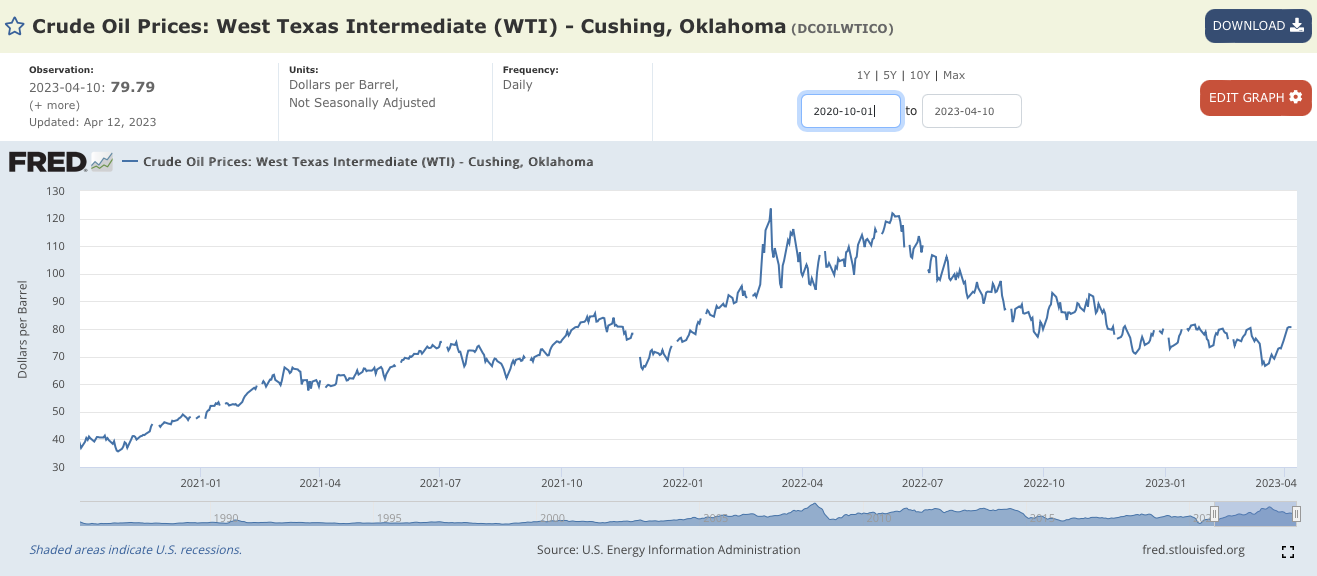
Crude oil prices have decreased somewhat since the July-September 2022 quarter, when they dropped from over $100 per barrel just below $80 a barrel. So far in 2023, prices have oscillated in the $70-80 per barrel range. So, while the rate of increase in the NHCCI may decrease in the coming quarters, there is no sign that they will give back significant amounts of what has already been increased.

(Also, even if and when petroleum gets cheaper, at some point the added money from the Infrastructure Investment and Jobs Act (IIJA) will test the capacity of steel mills, cement kilns, and gravel pits to produce materials in sufficient quantities to meet increased demand without more price increases, to say nothing of demands of labor for increased wages in a tight labor market.)

For years, we have tried to figure out the best measure of the lost buying power of federal dollars. When it comes to spending, the easiest thing to track is outlays, which are the cash dollars leaving the Treasury as they are transferred via check or wire to non-federal entities. These are reported monthly by the Treasury. But these outlays are usually paying off contracts which were signed months or years before, so they don’t really measure the effect that price increases have on newly signed contracts.

Fortunately, in 2017, usaspending.gov went online and lately it has gotten so user-friendly that it can be used to track obligations as well as outlays – not by month, but by by quarter. Obligations are the best proxy for contracts being signed (an obligation is recorded when FHWA approves a project agreement and commits a specific amount of federal dollars for a specific project).

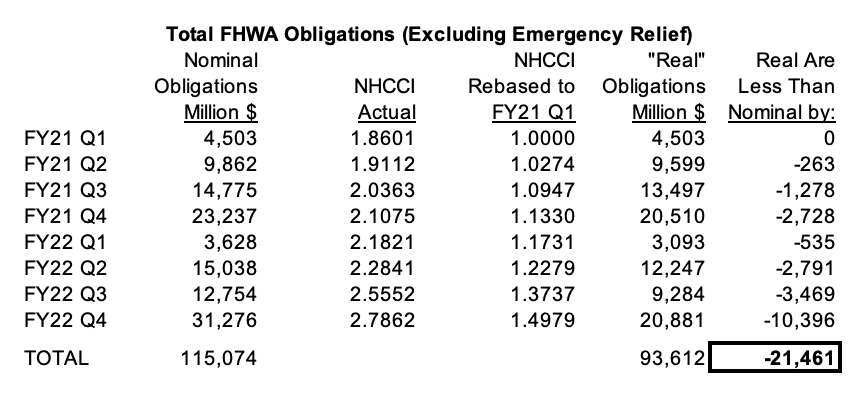
We added up the total obligations in each quarter for the two major FHWA budget accounts (the Federal-Aid Highways account (8083), which is all their spending from the Highway Trust Fund, and the Highway Infrastructure Programs account (0548), which is all of the general fund plus-ups from the regular appropriations bills combined with the IIJA advance appropriations from the general fund). This excludes periodic Emergency Relief appropriations.

Then, we re-based the NHCCI to start at the last low point on the chart above (Oct-Dec 2020) and deflated the obligation totals by dividing the nominal obligation totals by the rebased index number. The result is “real” buying power of those obligations, after removing the highway cost inflation since the end of 2020.

We calculate that federal highway spending has lost $21.5 billion in buying power since the end of 2020.

Search Eno Transportation Weekly

Latest Issues

Happening on the Hill