Fuel Efficiency Standards – California vs. the Feds (How We Got Here, and What Comes Next)
California and four major automakers (BMW, VW, Ford, and Honda) signed a voluntary agreement that appears to preempt the Trump administration’s attempt to roll back the Obama-era fuel efficiency standards (a measure of miles driven per gallon of fuel consumed). The California agreement introduces yet another proposed successor to the Obama-era federal fuel efficiency standards, which already include the eight proposed alternatives detailed by the Trump administration in the Safer Affordable Fuel Efficient vehicles program (SAFE), and the continuation of the original Obama-era Greenhouse Gas (GHG) and Corporate Average Fuel Economy (CAFE) standards. Whichever plan is eventually chosen will have a profound effect on the largest sector of GHG emissions in the U.S.
Complicating the issue of modifying federal fuel efficiency standards is the convoluted calculation methods that often lead to misrepresentation of the fuel economy standards. While they appear to be very straight forward, the actual calculations and rules comprise nearly 600 pages in the federal register and are a series of regulatory contradictions and are not nearly as harmonized as they could be. Before we dive into the potential implications of a fuel economy change, we should explore the evolution, calculations, and complications of the former, current, and proposed standards.
History of fuel efficiency standards
Fuel efficiency standards were first put in place following the Organization of Petroleum Exporting Countries oil embargo of 1973. Congress passed into law the Energy Policy and Conservation Act of 1975 (EPCA), which gave the Department of Transportation (DOT) the authority to set fuel efficiency standards for passenger cars and light trucks. The original intention of the fuel efficiency standards was to reduce reliance on foreign sources of oil by substantially increasing fuel efficiency.
That authority was always delegated to the National Highway Traffic Safety Administration (NHTSA). While it may seem strange that a safety agency is responsible for fuel economy, at the time (and likely still today) the easiest way to raise fuel economy would be through reducing vehicle weight, which would have affected crumple zones and the just-established safety ratings. At the time Congress likely did not want to split automobile regulatory authority among multiple agencies and NHTSA could moderate the balance .
Between 1973 and 1983, fleet fuel efficiencies more than doubled from 13.4 mpg to 27.5 mpg, surpassing the original passenger car standard of 18.0 mpg. The standards remained largely the same since then until Congress passed the Energy Independence and Security Act (EISA) in 2007, which amended EPCA to require substantial, continuing increases in fuel economy and reinforced George W. Bush’s executive order. When the Obama administration took office about a year later, they then set their own more stringent CAFE standards with the goal of creating a harmonized and consistent fuel economy and GHG standards for model years 2012-2016.
While NHTSA has the authority to regulate and enforce fuel economy standards, the EPA also has de facto ability to set fuel efficiency standards given its authority regulate mobile source pollutants, such as GHG, under Title II of the Clean Air Act (CAA). The CAA also grants states like California the authority to set their own more stringent emissions standards considering their unique geography and weather patterns. This state-level waiver effectively creates a third regulatory framework for vehicle manufactures to satisfy given California’s large share of the automobile market. The California waiver is one of the more contentious issues within the current administration, and there exist arguments both ways on its current and past legality.
The three-way regulatory environment made compliance difficult for automakers, so when the CAFE standards were revived under the Obama Administration, one of the goals was to harmonize the three fuel efficiency standards. The harmonized National Program involved three legal authorities for regulating fuel efficiency standards; NHTSA for the CAFE standards, EPA under section 202 of the CAA, and the California Air Resources Board (CARB) with their waiver granted under section 177 of the CAA. Under Phase I of the National Program, NHTSA would be responsible for setting the fuel efficiency standards and the EPA established global warming pollution standards that corresponded to the CAFE standards.
CARB accepted compliance of the weaker national standards with the understanding that California would become more stringent in Phase II, which would apply to model years 2017-2025. Because of the original statutory authority, GHG standards can essentially be set indefinitely; however, NHTSA can only make final rules on fuel efficiency for 5 consecutive model years. Because of this, the current CAFE standards are only final through model year 2021, with the standards for 2022-2025 proposed (referred to as augural) but not finalized meaning they have no enforceability. Because of the different time scales a midterm review was ordered to assess the feasibility of the augural standards. The review was completed shortly before Obama left office and indicated that the augural standards were appropriate. These finding were challenged by the Trump administration which used a separate review as justification for proposing SAFE.
Calculating and Harmonizing the CAFE, GHG, and CARB standards
Phase II of the National Program complicated the language around the CAFE standards. Phase II set a 2025 standard of 163 grams/mile of CO2 emissions, which would correspond to the widely circulated fuel economy standard of 54.5 miles per gallon (mpg) for combined cars and light duty trucks. However, 54.5 mpg assumes that the standards would be met by fuel efficiency improvements alone, without including any alternative compliance measures, and is actually a conversion of the EPA’s GHG standards even though it is erroneously reported as the CAFE standard. Phase II introduced a number of alternative compliance measures that could partially reduce that fuel economy standard by approximately 6 mpg.
- Credit averaging, banking, and trading – Allows credits to be earned from over-complying with the set standards. These credits can then be traded between manufacturers, banked for future use (up to 5 years), or applied to a previous imbalance.
- Air conditioning (A/C) improvement credits – Provides credits up to 18.8 grams/mile or 24.4 gram/mile for light duty trucks. These credits can account for approximately 6 mpg of the fuel efficiency standards. Credits incentivize switching to non-hydrofluorocarbon (HFC) coolants for the air conditioning systems along with technologies that prevent leakage.
- Off-cycle credits – Provides credits for efficiency improvements that would not be represented in the two cycle EPA tests. Examples include solar panels on the roof for charging electric vehicles, or aerodynamic improvements. These credits are for the types of real world improvements that would be better represented in the multi-phase EPA tests.
- Incentives for electric vehicles, plug-in hybrid electric vehicles, fuel cell vehicles, and compressed natural gas vehicles – Allows for a multiplier meaning alternative fuel vehicles count as more than one vehicle for compliance purposes. Electric and fuel fell started at 2.0 and would slowly phase down to 1.5, while plug in and natural gas had a 1.6 phasing to 1.3 multiplier.
- Incentives for use of advanced technologies including hybridization for full-size pickup trucks- gave various credits to promote fuel saving technologies in larger vehicles, up to 10g CO2 per mile.
Under the final rule, NHTSA estimates that with the alternative compliance measures, the average combined fuel economy standard in 2025, would be closer to 49.2 mpg. This number is still overstated from actual on-road fuel economy because of the EPA’s outdated two-phase (city and highway) testing for compliance. This testing model tends to overestimate fuel economy on average by 28%, though up to 42% in comparison to their five-phase testing that they use for “sticker mpg”. In another layer of complexity, the combined fleet average is based off of 2008 and 2010 fleet sales mixtures, which are quite different from the current split today (approximately 50/50 in 2008 and 2010 compared to approximately 70/30 light trucks to cars today).
Going deeper into the complex regulatory structure, the CAFE standards further vary for each vehicle based on size, beyond the passenger car and light truck dichotomy. In order to incentivize automakers to meet the standards in ways other than shrinking the size of a car, the CAFE standards vary based on the area of the undercarriage (calculated as the length from axle to axle and width between the tires). Based on this area, a particular car model must meet a given mpg standard per model year (See Figure 1 below for the curve example). So, in reality, each auto manufacturer has its own average fuel economy based on the weighted average of a manufacture’s fleet sold that year. This creates a more complex regulatory structure but gives manufacturers some flexibility on which vehicles to focus fuel efficiency increases for maximum return based on the footprint/mpg curve.
Figure 1. Passenger Car Fuel Curves (2012-2025)
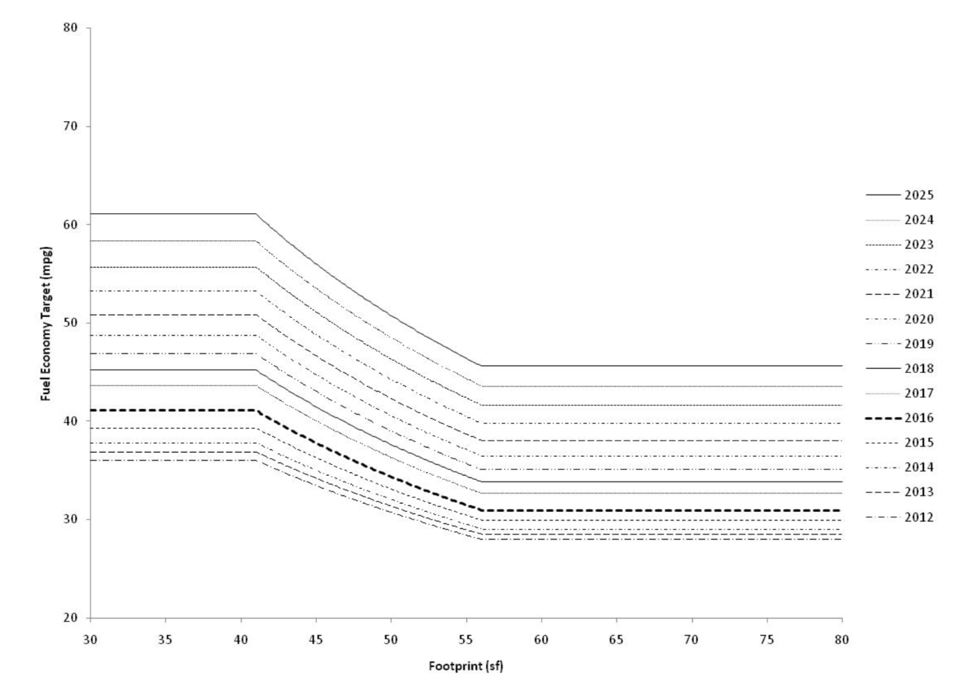
Source: NHTSA, CAFE 2017-25 Fact Sheet
Part of the reason automakers were supportive of the stringent standards set by the Obama Administration, was the goal of creating one national standard. However, due to statutory authority, NHTSA is unable to accommodate all of the exceptions put forward by the EPA (see Table 1). Because of the statutory authority given to NHTSA to regulate fuel economy standards, it would take a legislative act to change some of these authorities to truly harmonize the two set of standards.
Table 1: Differences between CAFE and GHG standards
| Issue | NHTSA (CAFE) | EPA (GHG) |
| Non-compliance | Fines can be paid to satisfy compliance issues | Fines do not cover compliance, civil enforcement |
| Credit Banking | Credits can be banked for 5 years | Credits can be banked for 5 years, however, those earned from MY2010-16 can be carried forward through MY 2021 |
| Credit Transfers | Transfer credits between fleet categories are capped. Any credits that are traded or transferred are subject to an adjustment factor | No limits on credits transferred or adjustment factor |
| Alternative Fuel Vehicles (AFV) | Credits are available for ethanol and methanol fueled vehicles. Electricity used to charge electric vehicles is converted to equivalent gallons of gasoline, and only 15% of that value is counted for compliance | AFV are subject to a multiplier counting them as more than a single vehicle, ranging from 1.3 -2.0 depending on vehicle type. Emissions from battery only electric vehicles are counted as zero (no upstream accounting) |
Source: https://fas.org/sgp/crs/misc/R45204.pdf
Plan Comparisons
Of the eight proposed alternatives to CAFE in SAFE, two would phase out the A/C efficiency and off-cycle provisions (Alternatives 3 and 7 are the same as 2 and 6 but with phase out provisions). All of the alternatives would eliminate the compliance credits for A/C refrigerant leakage, nitrous oxide, and methane emissions reductions. Even considering all of these credit removals (possibly requiring 6 mpg of actual fuel efficiency gains), Alternative 3 is still lower than the CARB and CAFE standards in all respects and Alternative 7 would have a lower car mpg and would almost equal the light truck standard.
The CAFE standards average a 5% increase in fuel economy between each model year. 2026 numbers are the same as 2025. The CARB values increase by 3.7% each year. While this is lower than CAFE, they become more or less equal because of the CARB increases continuing through 2026. SAFE Alternative 1 (PA1) would freeze the fuel efficiency standards at 43.7 and 31.3 mpg for cars and light trucks respectively through 2026. SAFE Alternative 2 (PA2) increases by 0.5% each year. Alternative 4 (PA4) increases by 1% for cars and 2% for light duty trucks. Alternative 5 (PA5) has the same increases as PA4, but they are delayed by one year, beginning in model year 2022 instead of 2021. Alternative 6 (PA6) increases by 2% for cars and32% for light duty trucks. Alternative 8 (PA8) has the same increases as PA6, but they are delayed by one year, beginning in model year 2022 instead of 2021.
Table 2: Yearly MPG Standards
| 2020 | 2021 | 2022 | 2023 | 2024 | 2025 | 2026 | ||
| *CAFE | Cars | 48.8 | 51.7 | 54.2 | 56.6 | 59.2 | 62.1 | 62.1 |
| Trucks | 33.0 | 35.7 | 37.5 | 39.5 | 41.5 | 43.8 | 43.8 | |
| **CARB | Cars | 48.6 | 51.4 | 54.2 | 56.3 | 58.4 | 60.7 | 63 |
| Trucks | 32.9 | 35.5 | 37.3 | 38.7 | 40.3 | 41.8 | 43.4 | |
| ***SAFE (1) | Cars | 43.7 | 43.7 | 43.7 | 43.7 | 43.7 | 43.7 | 43.7 |
| Trucks | 31.3 | 31.3 | 31.3 | 31.3 | 31.3 | 31.3 | 31.3 | |
| ***SAFE (2) | Cars | 43.7 | 43.9 | 44.1 | 44.4 | 44.6 | 44.8 | 45.0 |
| Trucks | 31.3 | 31.5 | 31.6 | 31.8 | 31.9 | 32.1 | 32.3 | |
| ***SAFE (4) | Cars | 43.7 | 44.1 | 44.6 | 45.0 | 45.5 | 45.9 | 46.4 |
| Trucks | 31.3 | 31.9 | 32.6 | 33.2 | 33.9 | 34.6 | 35.2 | |
| ***SAFE (5) | Cars | 43.7 | 45.8 | 46.2 | 46.7 | 47.1 | 47.6 | 48.1 |
| Trucks | 31.3 | 32.8 | 33.5 | 34.1 | 34.8 | 35.5 | 36.2 | |
| ***SAFE (6) | Cars | 43.7 | 44.6 | 45.5 | 46.4 | 47.3 | 48.2 | 49.2 |
| Trucks | 31.3 | 32.2 | 33.2 | 34.2 | 35.2 | 36.3 | 37.4 | |
| ***SAFE (8) | Cars | 43.7 | 45.8 | 46.7 | 47.6 | 48.6 | 49.5 | 50.5 |
| Trucks | 31.3 | 32.8 | 33.8 | 34.8 | 35.9 | 36.9 | 38.0 |
Notes: *Cafe standards are converted from EPA GHG standard (8887 g CO2 per gallon) **Carb numbers are estimates based on preliminary information of a final combined standard equal to original CAFE. Numbers were extrapolated back from final, using average increase of 3.7% ***Unclear where the original starting values for the SAFE proposal originate from as they do not correspond to any previous value in the federal register.
Using the calculated MPG values above, as a thought experiment, I modeled each scenario to determine potential GHG emissions over the lifetime of the fleet (Figure 2).
Figure 2
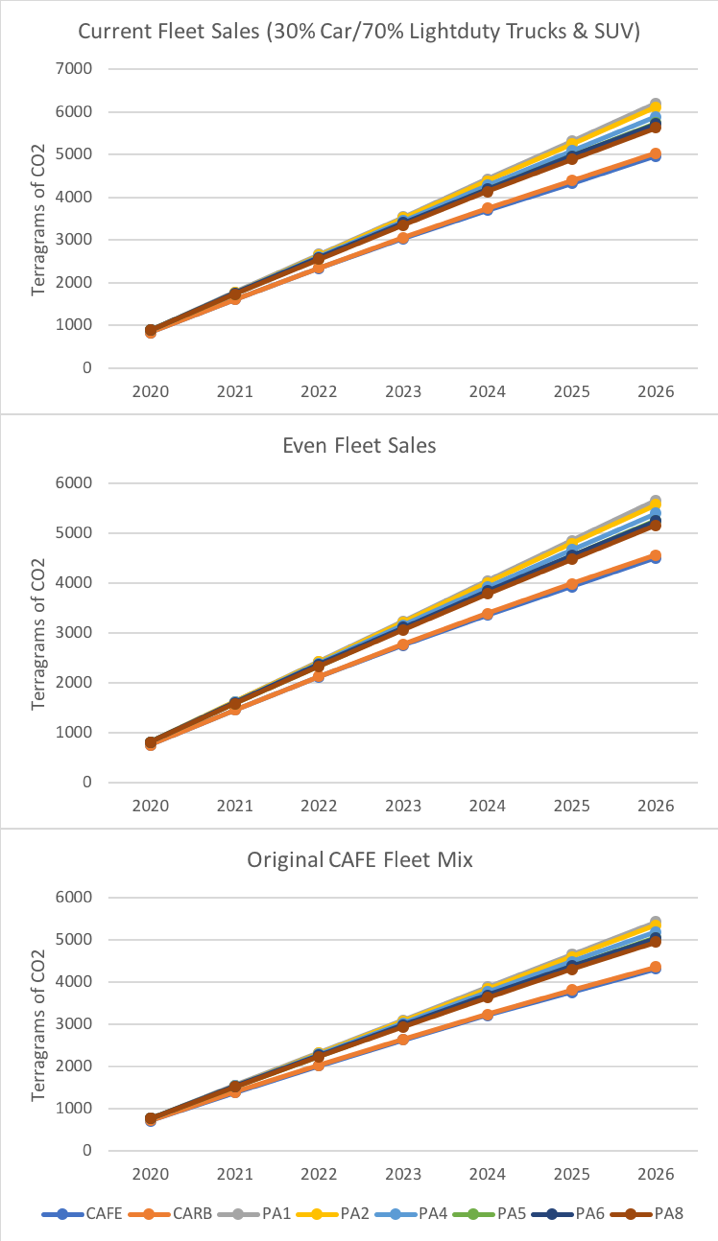
Sources: Transportation Energy Data Book Edition 37.1 ; EIA ; EPA
To put the numbers in context, the SAFE proposals would likely contribute 5600 to 6200 teragrams (Tg) of greenhouse emissions over the lifetime of the combined fleets (estimates of annual U.S. GHG contributions are approximately 5500 Tg from all sectors). In contrast, the CARB proposal and Obama CAFE standards each contribute around 5000 Tg, between 12-25% less than the SAFE alternatives, but still a significant contribution. As noted before, Alternatives 3 and 7 of SAFE could raise the standards of Alternatives 2 and 6 by approximately 6 mpg, making Alternative 6 more comparable to the CARB and CAFE standards.
Current fleet sales have a large effect on potential GHG emissions. Under current vehicle sale scenarios (70% light duty truck/SUV and 30% cars) projected contributions are 10% higher than an even 50/50 split and 15% higher than the CAFE standards projected mix (58.5% cars and 41.5% light duty truck/SUV). Current transportation sector GHG contributions are just over 1500 Tg from on road sources and 1100 Tg from all light-duty vehicles.
Despite the bickering and potential litigation around the SAFE and CARB standards, the disparity in their potential emissions is not that vast, especially if you consider Alternatives 7 and 8 of the SAFE standards. Instead of focusing massive amounts of effort on which proposal to choose, there is clearly room to compromise and negotiate. Bringing CARB, the Trump administration, and automakers together could result in a compromise that accomplishes GHG reductions similar to the original Obama CAFE standards. They could also take this opportunity to accomplish something all parties strive for – a truly harmonized fuel economy standard that allows for clear standard compliance.

