Earlier today (a day ahead of schedule), the Federal Transit Administration announced the apportionment and allocation of $24.925 billion in emergency appropriations to mass transit agencies across the country. The money was provided by the $2+ trillion coronavirus response bill signed into law six days ago.
“This historic $25 billion in grant funding will ensure our nation’s public transportation systems can continue to provide services to the millions of Americans who depend on them,” said U.S. Transportation Secretary Elaine Chao.
The law provided that $75 million out of the original $25.0 billion appropriation be taken “off the top” for FTA administration and oversight, and the rest be apportioned to states via five different formulas, each in the proportion that the formula total in fiscal 2020 bore to all formula apportionments:
- The 49 U.S.C. §5307 urbanized area formula (55.1604%);
- The 49 U.S.C. §5311 non-urbanized (a.k.a. rural) formula (7.9818%);
- The 49 U.S.C. §5337 state-of-good-repair formula (30.0316%);
- The 49 U.S.C. §5340 high-density state formula (3.4618%); and
- The 49 U.S.C. §5340 growing state formula (3.3645%).
For program administration and record-keeping purposes, all the other money was then to be folded into either the urban or rural area formula program. The rural program then had set-asides for Appalachian and Indian programs taken out. It wound up working out like this:

In terms of which area or agency gets what money:
- The list of which urbanized areas get what dollar amounts from the $22.7 billion §5307 apportionment is here;
- The list of which states get what dollar amounts from the $2.2 billion §5311 apportionment and the $20 million Appalachian set-aside is here; and
- The apportionments under the Indian reservations set-aside are here.
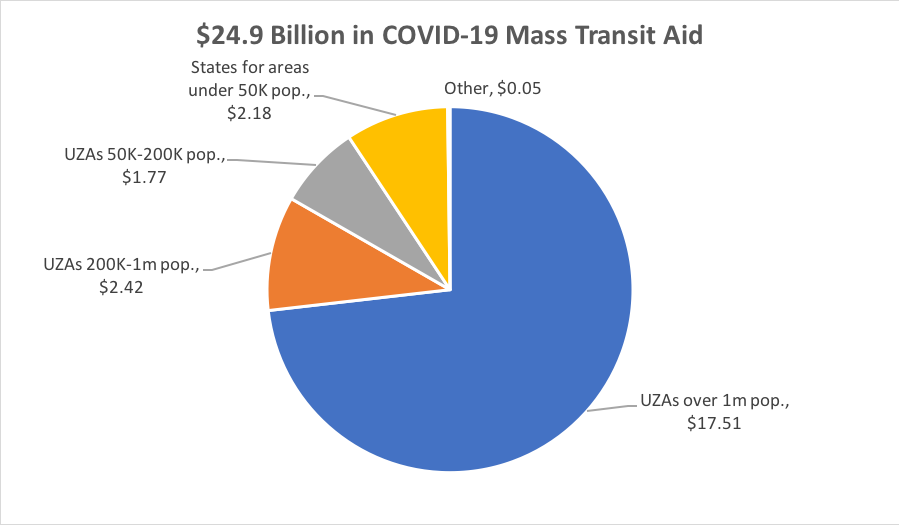
Here’s how it broke down in terms of how much money went to urbanized areas of specific population sizes, versus to states for rural areas:
Normally, apportionments under §5307 and §5311 come with a whole host of strings attached, but those conditions and restrictions are superseded by the language of the appropriations bill, which says that the money is “to remain available until expended, to prevent, prepare for, and respond to coronavirus…Provided further, That notwithstanding subsection (a)(1) or (b) of section 5307 of title 49, United States Code, funds provided under this heading are available for the operating expenses of transit agencies related to the response to a coronavirus public health emergency as described in section 319 of the Public Health Service Act, including, beginning on January 20, 2020, reimbursement for operating costs to maintain service and lost revenue due to the coronavirus public health emergency, including the purchase of personal protective equipment, and paying the administrative leave of operations personnel due to reductions in service…” Other variances from underlying statute are listed here.
Operating expenses dating back to January 20, 2020 are eligible for this funding.
FTA has prepared a FAQ document giving further explanation of how the funds can be used. Recipients should note the requirements that the new funding still needs a Labor Department sign-off, and that the split of urbanized money between political entities still needs to be updated for the new funding.
The bulk of the money ($17.5 billion) went to urbanized areas with populations over 1 million. Here is how that money was distributed:
| Atlanta, GA |
$370,947,760 |
| Austin, TX |
$104,057,727 |
| Baltimore, MD |
$385,511,664 |
| Boston, MA-NH-RI |
$883,963,957 |
| Massachusetts |
$875,853,557 |
| New Hampshire |
$8,078,567 |
| Rhode Island |
$31,833 |
| Charlotte, NC-SC |
$63,620,890 |
| North Carolina |
$60,524,710 |
| South Carolina |
$3,096,180 |
| Chicago, IL-IN |
$1,481,734,139 |
| Illinois |
$1,430,312,048 |
| Indiana |
$51,422,091 |
| Cincinnati, OH-KY-IN |
$57,339,245 |
| Ohio |
$45,389,982 |
| Kentucky |
$11,587,728 |
| Indiana |
$361,535 |
| Cleveland, OH |
$123,467,325 |
| Columbus, OH |
$53,174,170 |
| Dallas-Fort Worth-Arlington, TX |
$318,629,129 |
| Denver-Aurora, CO |
$209,393,920 |
| Detroit, MI |
$133,892,582 |
| Houston, TX |
$258,569,336 |
| Indianapolis, IN |
$44,567,016 |
| Jacksonville, FL |
$42,553,101 |
| Kansas City, MO-KS |
$51,271,164 |
| Missouri |
$29,592,282 |
| Kansas |
$21,678,882 |
| Las Vegas-Henderson, NV |
$112,263,863 |
| Los Angeles-Long Beach-Anaheim, CA |
$1,215,978,439 |
| Memphis, TN-MS-AR |
$35,687,809 |
| Tennessee |
$30,580,056 |
| Mississippi |
$3,883,604 |
| Arkansas |
$1,224,149 |
| Miami, FL |
$454,725,282 |
| Milwaukee, WI |
$62,363,348 |
| Minneapolis-St. Paul, MN-WI |
$226,499,058 |
| Minnesota |
$226,481,413 |
| Wisconsin |
$17,645 |
| New York-Newark, NY-NJ-CT |
$5,437,225,776 |
| New York |
$3,790,512,656 |
| New Jersey |
$1,475,746,282 |
| Connecticut |
$170,966,838 |
| Orlando, FL |
$93,372,699 |
| Philadelphia, PA-NJ-DE-MD |
$879,074,361 |
| Pennsylvania |
$700,514,215 |
| New Jersey |
$124,045,850 |
| Delaware |
$49,655,777 |
| Maryland |
$4,858,519 |
| Phoenix-Mesa, AZ |
$188,416,721 |
| Pittsburgh, PA |
$162,133,877 |
| Portland, OR-WA |
$201,925,350 |
| Oregon |
$176,302,899 |
| Washington |
$25,622,451 |
| Providence, RI-MA |
$123,999,409 |
| Rhode Island |
101,223,097 |
| Massachusetts |
22,776,312 |
| Riverside-San Bernardino, CA |
$137,566,673 |
| Sacramento, CA |
$112,136,861 |
| Salt Lake City-West Valley City, UT |
$112,091,799 |
| San Antonio, TX |
$93,287,276 |
| San Diego, CA |
$314,267,559 |
| San Francisco-Oakland, CA |
$822,593,563 |
| San Jose, CA |
$196,849,871 |
| San Juan, PR |
$96,100,590 |
| Seattle, WA |
$520,621,224 |
| St. Louis, MO-IL |
$151,531,678 |
| Missouri |
$133,524,916 |
| Illinois |
$18,006,762 |
| Tampa-St. Petersburg, FL |
$91,119,942 |
| Virginia Beach, VA |
$63,837,553 |
| Washington, DC-VA-MD |
$1,020,220,909 |
| Virginia |
$248,902,420 |
| Maryland |
$235,661,687 |
| District of Columbia |
$535,656,802 |
|
|
| Total |
$17,508,584,615 |

