June 16, 2017
The Federal Highway Administration has released the end-of-year 2016 Urban Congestion Report (UCR). The report includes data from the 52 largest metropolitan statistical areas in the United States measuring congestion, travel time, and travel time reliability for trucks and passenger vehicles on the National Highway System.
The data used are a relatively young, uniform, national dataset called the National Performance Management Research Data Set (NPMRDS), which has 24-hour speed and travel time data along the entire NHS. It is currently being used by both the FHWA and various regional transportation organizations to look at current conditions, examine trends, and discuss the performance of the NHS for vehicular traffic.
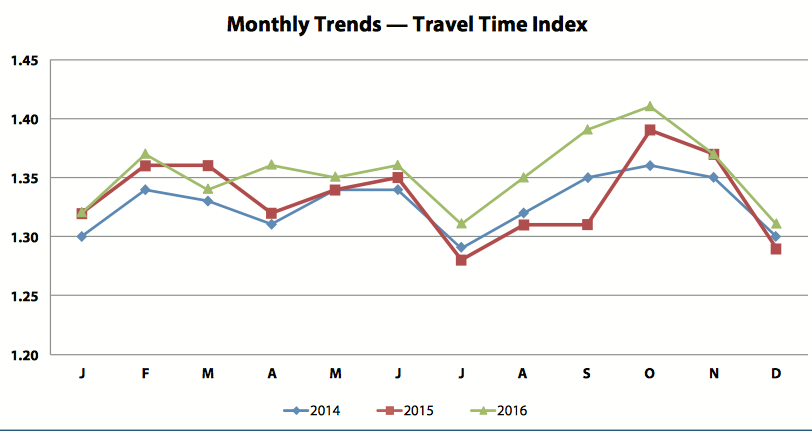
Overall, 10 of the 52 metropolitan areas improved in all three measures, and 11 declined in all three. Geographically, cities in the Southeast and the West generally saw worsening congestion, while cities in the Northeast generally improved from 2015 to 2016 (with the exceptions of Washington DC and Philadelphia). Across the 52 areas, the number of congested hours increased from 4 hours and 40 minutes in 2015 to 4 hours and 43 minutes in 2016, the travel time index increased by one point, and the planning time index decreased by 3 points.
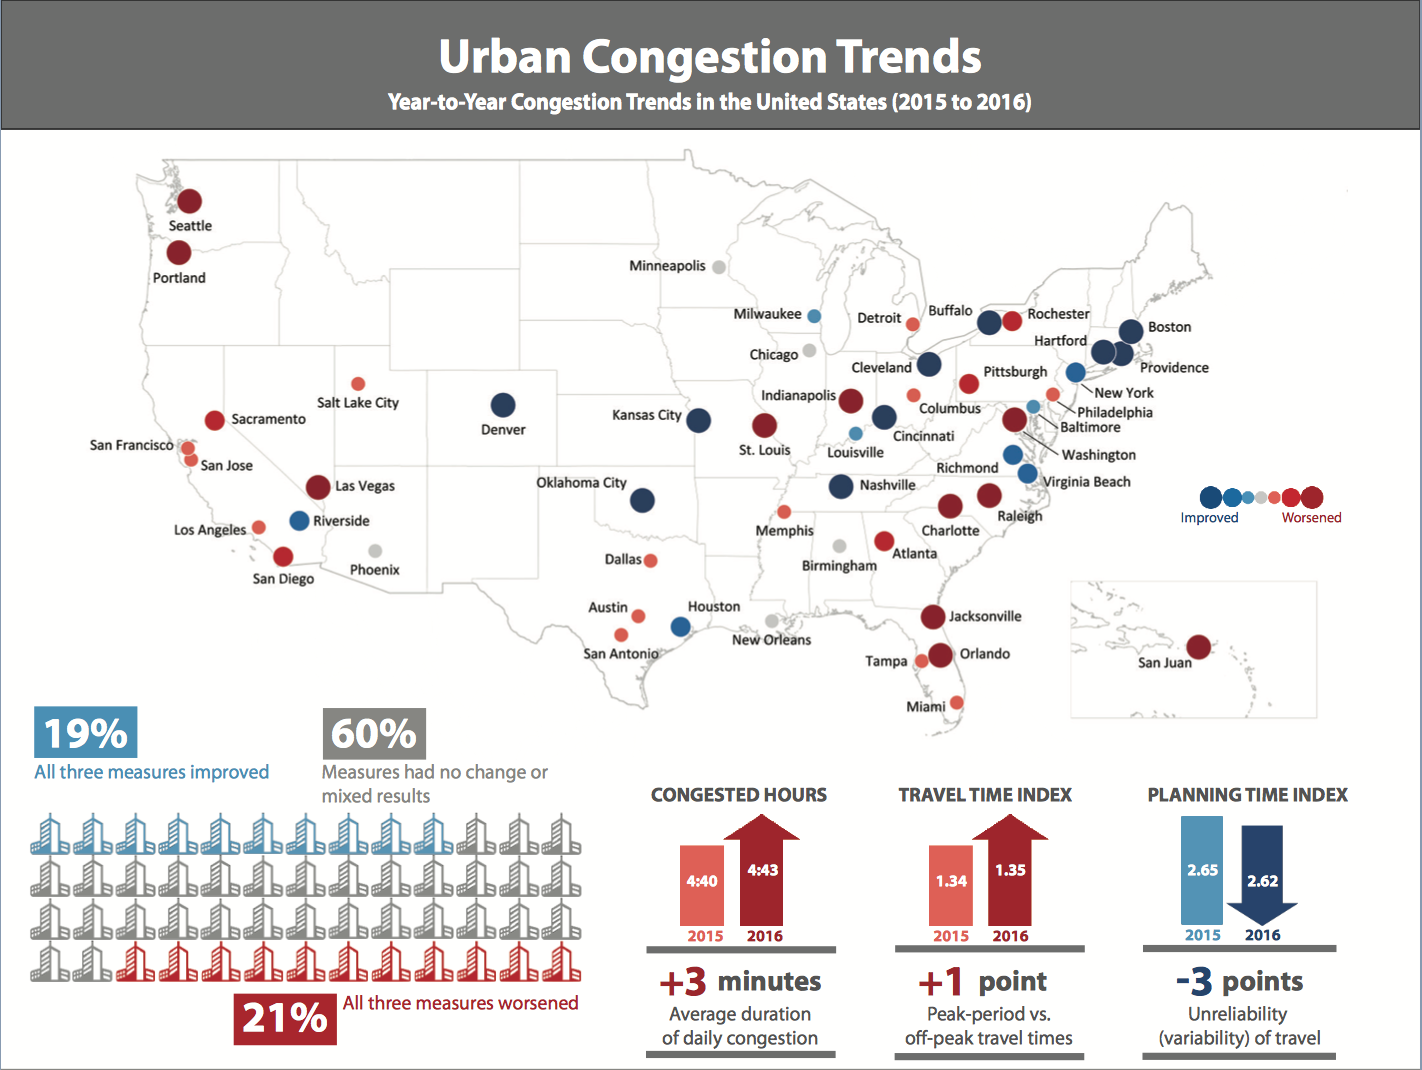
The three measures suggest that congestion has not, overall, increased significantly in the largest metropolitan areas in the country over the last year, (or the last two years). Given that national VMT increased by 88 billion miles from 2015 to 2016, such a slow rise in congestion levels may be seen as encouraging – some major metropolitan areas seem to have been able to manage increased demand. Perhaps transportation systems are being planned or engineered better. Perhaps the additional miles driven are not on NHS roads or are not during peak hours. There could also be a spatial mismatch that is lost when comparing averages or the slow increase in congested hours could indeed account for a large amount of these additional miles driven.
The UCR gives examples of regions that have used technology interventions to improve travel times on interstate and NHS roads. Variable signage and real-time information were common interventions associated with studies showing improvement in congested condition.
The measures included in the UCR have been used and critiqued for many years. Whether or not the current measures are the best to use when assessing congestion, maintaining a uniform dataset is necessary for effective performance-based planning.
The FHWA contributes to their goal of encouraging performance management at the state and regional level by providing data to agencies and examining the data on a national scale. The MAP-21 system performance rulemaking requires State DOTs and MPOs to use measures and establish targets for system level of travel time reliability (LOTTR) for interstate and NHS roads. The same rule making also requires truck travel time reliability (TTTR) measures. The NPMRDS dataset provides DOTs and MPOs with data needed to fulfill these MAP-21 requirements.