Evaluating Point-to-Point Mobility on Demand: Lessons from Los Angeles
In January 2019, LA Metro launched a first-mile, last-mile mobility on demand (MOD) pilot with the ridehailing service Via. This pilot was a part of the Federal Transit Administration’s mobility-on-demand sandbox program, which funded pilot programs across the country that aimed to incorporate mobility-on-demand technology into existing transit service.
Phase 1 of the MOD pilot in Los Angeles, which ran from January 2019 to March 2020, offered free shared rides to and from select rail transit stations in three service zones in the Los Angeles region. LA Metro and their partner research team collected robust data on the pilot, and Eno has published a series of research reports evaluating how the pilot addressed contracting, data sharing, fare integration and accessibility. In the reports, readers can find more information about how the pilot worked, the data available, and the outcomes of Phase 1 of the pilot.
In response to the COVID-19 pandemic, the MOD pilot suspended shared rides and began allowing point-to-point rides within the pre-existing zones beginning in March 2020, and expanded the zones to include key nearby destinations such as grocery stores and healthcare facilities. LA Metro also used the service to provide food delivery to vulnerable communities experiencing reduced food access (analysis forthcoming). This shift marked the beginning of Phase 2 of the pilot, running from March 2020 to January 2021.
These changes reflected a significant shift in the pilot’s intended purpose, and served as a unique opportunity to compare how a point-to-point MOD service fared compared to a first-mile last-mile service. This article summarizes key findings from Phase 2 of the Los Angeles MOD pilot using data collected by the MOD research team.
Trip Characteristics
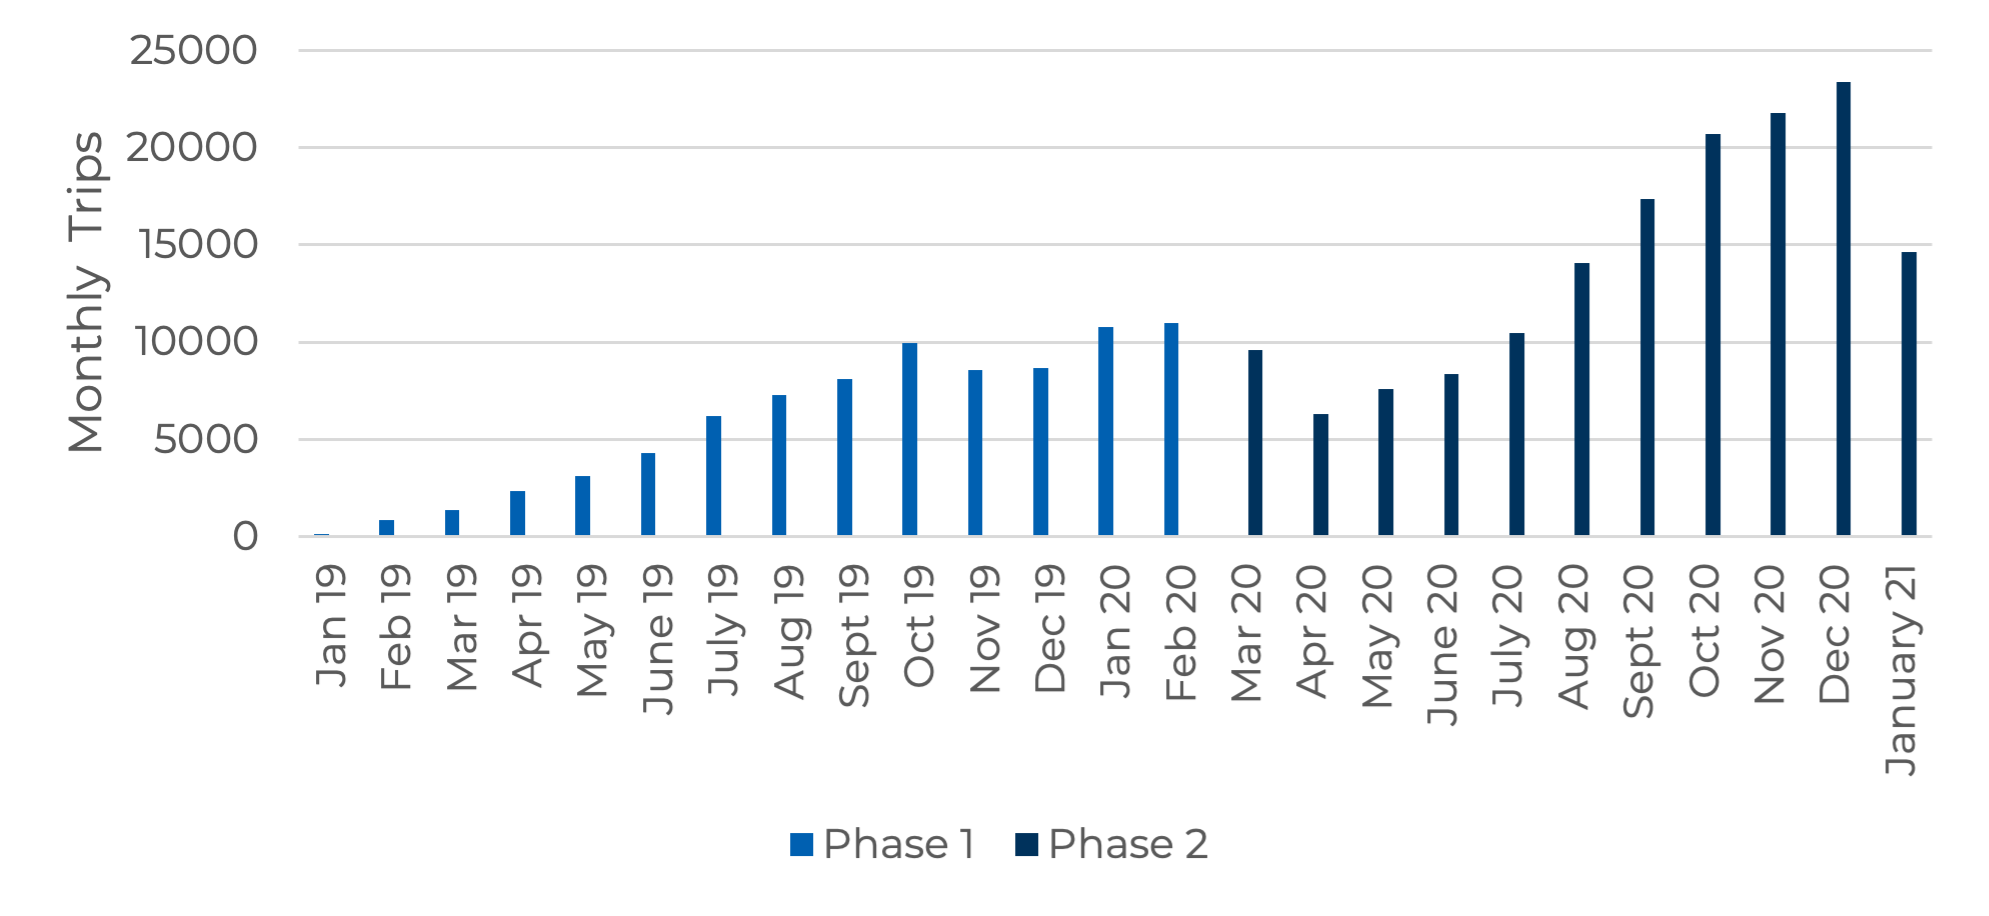
Among the most notable results of the shift to a point-to-point service was the marked increase in trips taken, as illustrated in Figure 1. From March 2020 to January 2021, drivers completed 154,275 trips, nearly double the 83,000 trips taken from January 2019 to February 2020. Comparatively, Metro fixed route service experienced an initial reduction in ridership of 70% and has not recovered to pre-COVID levels as of May 2022. Not only did the total number of completed trips increase, but so did the number of unique riders, though at a much smaller rate. This reflected a continued increase in users that began prior to the pandemic.
Figure 1: Total Monthly Trips Completed
Most pilot users who completed a ride also used the service again. Only 13 percent of users took just one ride with the pilot. 32 percent of riders took at least one trip a month, while just over a quarter were regular riders that took more than one trip a month. Among the cohort of regular riders, however, was a small share of “super users”. Nearly 40 percent of the total trips taken in Phase 2 were completed by just 5 percent of riders (314 people).
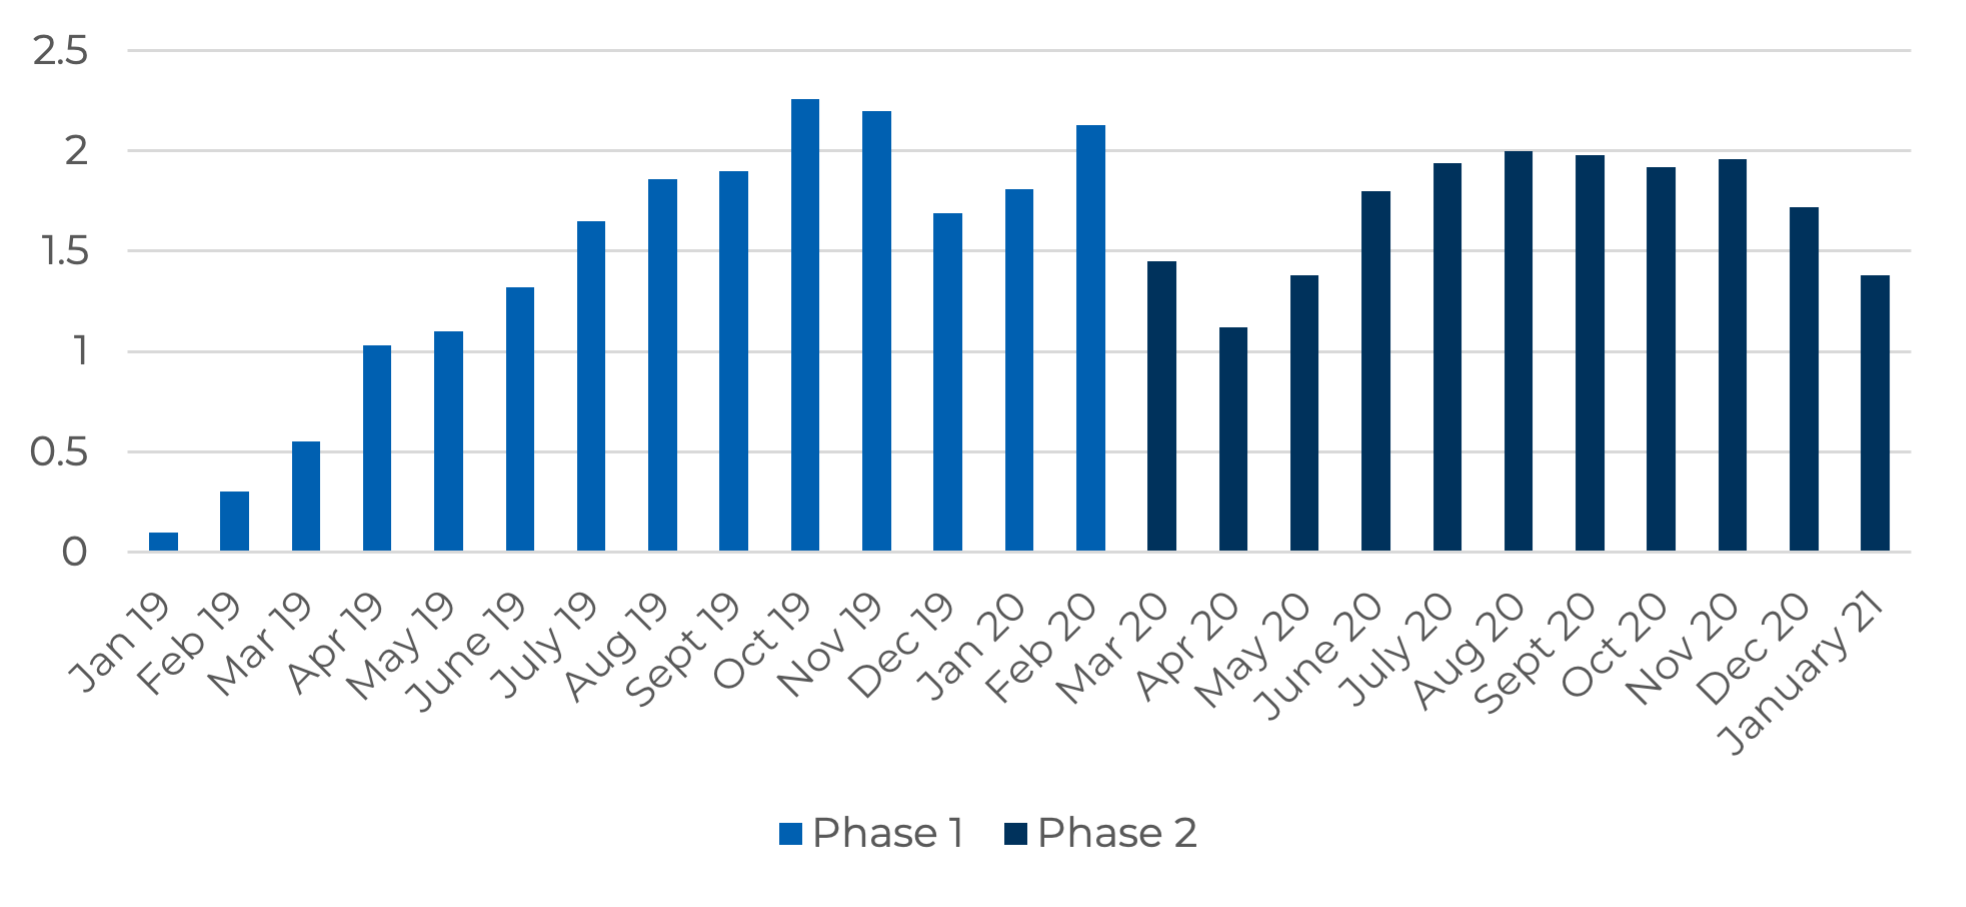
In response to higher demand during the second phase of the pilot, the number of driver hours per month increased by 46% percent, though the number of average rides per driver hour decreased slightly (1.69 in Phase 2 compared to 1.87 in Phase 1) and generally remained steady, as shown in Figure 2. Given shared rides were suspended during Phase 2 due to the pandemic, the similar utilization rates indicate some improvement in service efficiency as vehicles were required to operate at reduced capacity. These averages indicate that while the total number of rides and driver hours increased significantly, the actual utilization of drivers remained relatively low both before and after the shift to point-to-point service.
Figure 2: Rides per Driver Hour
In addition to measuring driver utilization and the number of trips completed, it is helpful to compare how the types of trips taken differed from Phase 1 to Phase 2. Broadly speaking, trips had a median length of 2.09 miles in Phase 2 compared to 2.28 miles in Phase 1. However, because riders were allowed to request point-to-point rides both within their service areas as well as to select essential services outside of the service area, the average trip length increased from 1.5 to 2.4 miles. This likely reflects longer, outlier trips that were permitted as part of the Phase 2 pilot parameters.
Wait times for riders increased slightly across the entire pilot, potentially due to higher demand. Riders waited an average of 11 minutes for rides during Phase 2, compared to 9 minutes in Phase 1. Much of this increase was driven by longer wait times in the El Monte and Artesia service areas – which experienced wait time increases of 27 and 48 percent over the pre-COVID Phase 1 of the MOD service, respectively. (Transit connections to the Artesia station were limited during much of MOD Phase 1 as the station closed through November 2019 due to a major rail maintenance project.) In the North Hollywood service area, wait times actually decreased by 6 percent. Average wait times were higher for trips that began near the edges of the service areas.
According to rider survey results in Figure 3, a vast majority of riders used the point-to-point service to commute to work or run errands. Notably, a majority of ride requests occurred during off-peak hours, suggesting that the pilot’s rider base may work jobs that require non-traditional hours.
Figure 3: Share of respondents who have used Metro rideshare for various trip purposes1
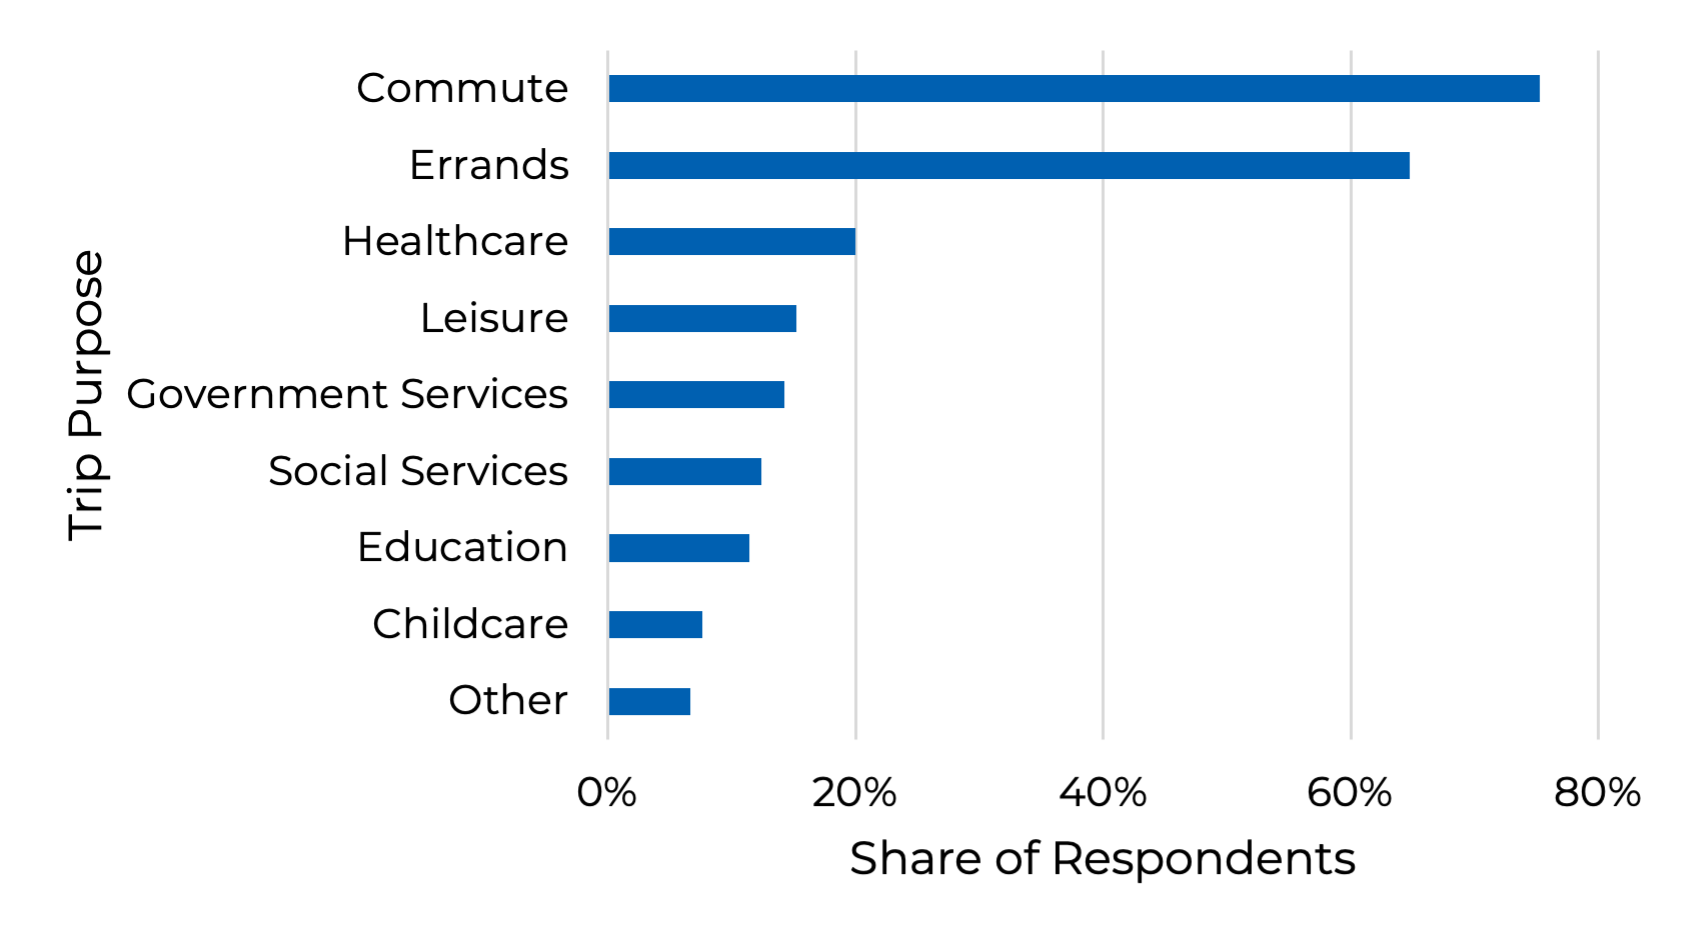
1Government services (e.g., court, city hall, county admin); Social services (e.g., support orgs, community facilities)
Rider Demographics
Pilot participants tended to be younger than regular LA Metro riders and LA County at large. Users also had higher incomes compared to regular LA Metro riders, but lower incomes than the county average. The racial/ethnic diversity of the pilot’s users generally mirrored those of LA Metro riders, which include a higher proportion of non-white riders. A majority of riders (57 percent) were also TAP card (LA Metro’s farecard) holders, indicating that they were at least somewhat frequent transit riders.
A very small share of ride requests were for wheelchair accessible vehicles (WAVs). Only 0.24 percent of all rides completed were with WAVs in Phase 2, a decrease from 0.97 percent in Phase 1 despite the eligibility of point-to-point rides and trips to destinations outside of the service area. For context, over 10 percent of LA County residents report having a disability, of which 5.7 percent are individuals with ambulatory disabilities, suggesting that the pilot was not heavily utilized for WAV rides.
Program Costs
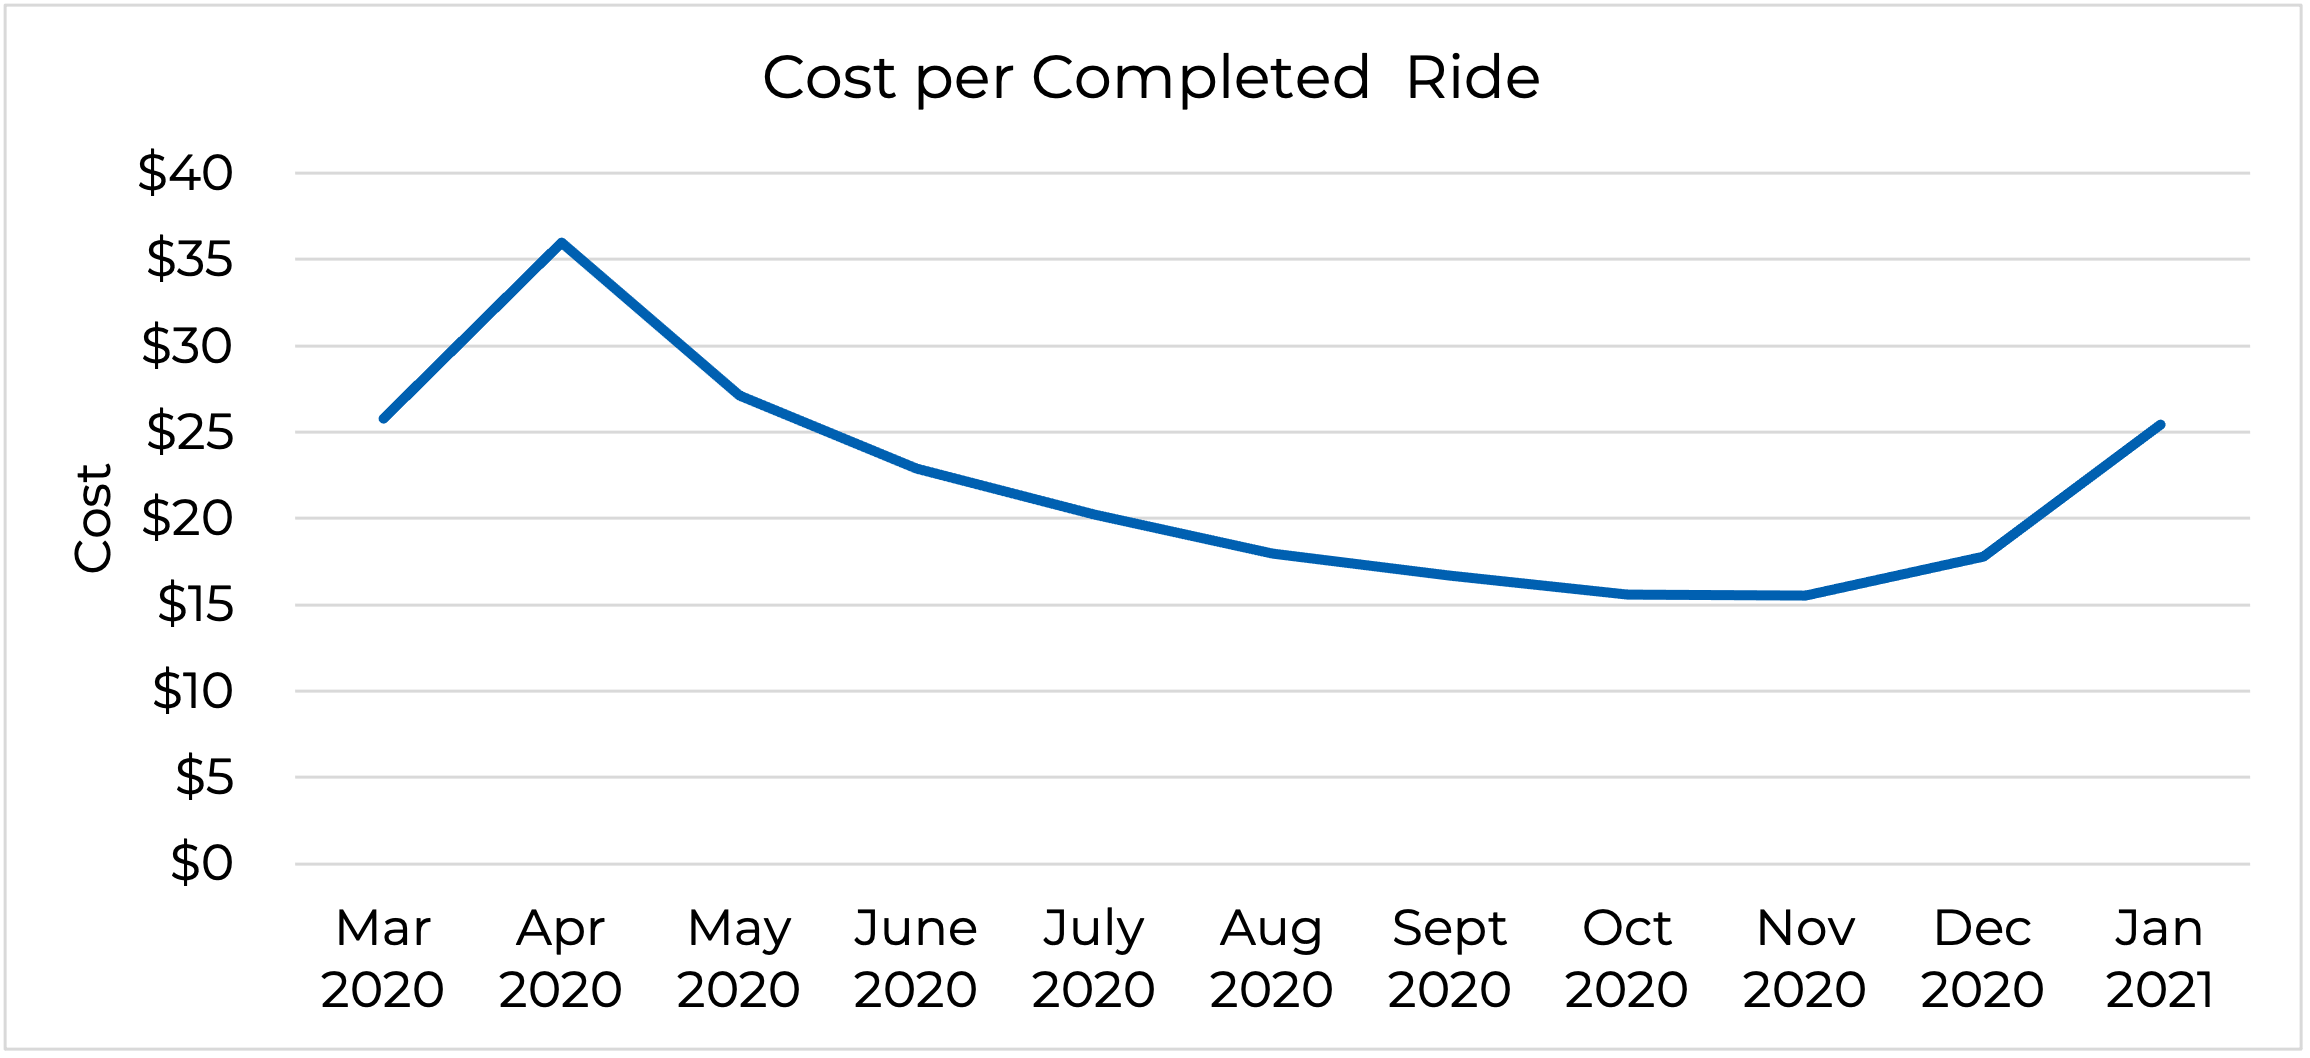
Though there is not sufficient data to analyze the cost and benefit of the pilot to LA Metro, the program operated at an average cost of $20.34 per trip. Monthly costs increased during Phase 2 of the pandemic (an average of $256,354 per month), though the cost per trip appeared to decrease as more rides were completed, as illustrated below. With free fares during Phase 2 of the pilot, this program essentially served as a fully subsidized ride hail service for riders in select zones.
Figure 4: Phase 2 Program Costs per Completed Ride
Lessons Learned
The transition from station-based to point-to-point service provided MOD users with more flexible options both within their respective service areas as well as to essential destinations elsewhere in the region. With rides nearly doubling in Phase 2, the availability of free, on-demand, point-to-point rides was evidently popular. Given that most survey respondents cited free fares as their favorite part of the pilot, it is difficult to tell whether rides would have increased as significantly absent free fares. Even so, given that LA Metro fixed ridership decreased dramatically at the outset of the pandemic and has yet to recover to pre-COVID levels, there is some indication that MOD provided riders with an alternative transportation option that may have been perceived as safer and delivered a better customer experience than fixed route.
However, the doubling of total rides completed or the switch from share rides to single rides did not appear to result in significant increases in driver utilization, nor draw in a major swath of new users. The average number of completed trips per driver hour fell 9 percent from Phase 1 to Phase 2.
While the number of unique riders did grow during Phase 2 of the pilot, much of the benefits of the pilot were concentrated among a small share of super users. Given that most riders were also TAP card holders, it is also plausible that the point-to-point service offered by Via captured riders who otherwise would have taken transit but opted not to either due to COVID-19 concerns, convenience, the free fares on the pilot, or a combination of these factors.
Without more detailed origin and destination data on rider commutes and errands, it is difficult to assess whether the pilot helped bridge gaps in LA Metro’s existing transit services, or simply captured riders that would have otherwise taken a bus or train to their jobs or errands. Requests for WAV rides, for example, were less than one percent of total requests despite the availability of direct, point-to-point service and accommodations for wheelchair users.
While a case can likely be made either way over whether this pilot was an effective use of Metro resources, it likely served its intended purpose of providing expanded mobility options to riders during the pandemic, especially given the dramatic reduction of ridership on fixed route services over the same period. Agencies considering similar pilots should carefully consider the intended users of such a service and assess whether and how on-demand service would complement existing service. Agencies should also compare costs per trip and per rider across existing service options to determine whether the benefits from a similar MOD service would outweigh the added expense.

