In July, the Eno Center for Transportation published a major report investigating the high costs and long timelines of rail transit construction in the United States. As part this work, we developed a construction cost database for 180 rail transit projects in the United States, Western Europe, and Canada.
The next phase of our work is expanding the international comparisons and data points to include an analysis of transportation governance and decision-making in areas not fully covered in the first report. When published, this research will examine how these countries plan, approve, fund, and deliver projects, with the aim of drawing comparisons to the U.S. and uncovering more best practices. The expanded scope includes:
- Canada
- Chile
- Mexico
- Norway
- Germany
- Italy
- Australia
- Japan
- South Korea
- South Africa
The research is still in progress, but some valuable insights and new data points are worth sharing. We are releasing an update to our database, adding construction cost and timeline data on 40 new projects from Australia, Norway, South Africa, Japan, Chile and Germany. We have added these new projects into our database, and have conducted some preliminary analysis of these new projects. The following outlines some initial takeaways, with more detail on each case to come in our forthcoming report.
Overview of New Additions
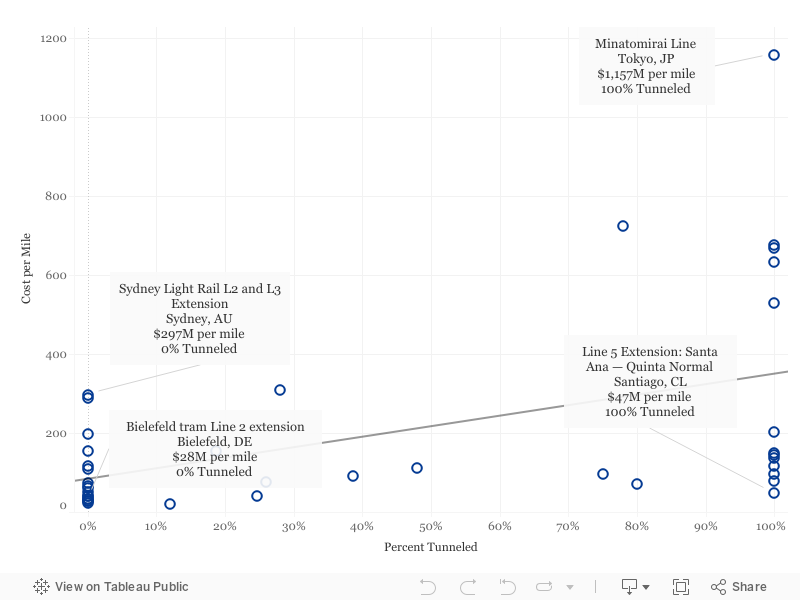
Figure One: Grade Alignment vs. Cost per-mile (Newly Added Projects from Australia, Norway, South Africa, Japan, Chile and Germany)
South Africa
Among the new additions to the database is a single commuter line in South Africa, the Gautrain, linking Johannesburg and Pretoria. The 50 mile line includes a nine mile tunnel under Johannesburg and was delivered using a public-private-partnership in part to gain access to private lending. The line was delivered at a cost of $155 million per mile, which is on the higher end of the at-grade construction cost spectrum (by comparison, the U.S. average is $119 million per-mile), but trains can travel up to 99 miles per hour.
Japan
Despite Japan being known for high-quality rail operations, the country featured four of the five most expensive tunneled projects in the new data group, averaging $748 million per-mile. The 2.5 mile Minatomirai Line in Yokohama is the highest at nearly $1.2 billion per-mile, making it the third most expensive project in the database (surpassed only by New York City’s Second Avenue Subway and 7 Line Extension). The project’s high cost may be partially explained by the complex site conditions along the project alignment, including a high share of reclaimed land in the city center. Many of the other tunneled projects in Japan included complex capacity expansion projects along existing transit routes, in addition to new lines.
Chile
Among the most notable findings in our expanded scope were the eight low-cost subway buildouts in Santiago, Chile. Since 2000, Santiago has built 33 miles of new subway at an average cost of $122 million per-mile and average construction timeline of 3.9 years. Those costs and timelines rival those of Madrid, whose successful subway buildouts between 1995 and 2015 cost an average of $178 million per mile and were among the least expensive in our initial database. Among the factors contributing to Chile’s low construction costs are centralized planning and decision-making process at the national level, favorable soil conditions, and strong staff capacity and expertise. Our Chilean research also uncovered low-cost, at-grade projects like the 27-mile light rail system in Valparaiso, which is tunneled for 12 percent of its alignment and completed at just $20 million per mile.
Norway
Like Santiago, Oslo has also completed some low-cost, below ground projects. These include the one-mile Løren Line, completed at a cost of $152 million per-mile, and the 3.1 mile Oslo Ring Line at a cost of $70 million per-mile. Interviewees noted that the infrequent pace of projects has made it difficult to accumulate large in-house expertise for projects, but acknowledged that there is a sizeable market of firms with tunneling expertise in Norway. One potential explanation for the low costs of these three projects is the general lack of underground stations (our initial data analysis found that stations can account for up to 25 percent of project costs for underground lines). The Oslo Ring Line runs below ground but returns to the surface to serve its stations, while the Løren line includes just one underground station.
Another notable buildout was the construction of a new light rail system in Bergen, Norway. The 13-mile long system has been built in three phases, and includes a mix of tunneled, at-grade, and elevated segments. Construction costs range from as low as $41 million per-mile for the initial phase of the system to $90 million per-mile for the most recent extension, which runs below ground for 39 percent of its alignment. The system intentionally does not feature any underground stations as a cost-savings measure.
Germany
The nine newly added German projects include a higher-than-average underground line and a series of low-cost tram lines ranging from $23 to $61 million per-mile. Many of these trams run through dense city centers, similar to other European tram projects. Taken together, the eight German tram projects cost an average of $36 million per-mile to build, placing Germany among the lowest at-grade construction costs in our database, among the lowest across countries sampled. In contrast, the North-South Light Rail line in Cologne, Germany was completed at a cost of $668 million per-mile, which is in line with the relatively high cost of other tunneled projects in Germany like the City Tunnel in Leipzig ($712 million per-mile) and the Wehrhahn Line in Dusseldorf ($678 million per mile). Compared to countries like France, Italy, and Spain, German subway construction costs are on the higher end of the cost spectrum, while its at-grade construction costs are among the lowest in our database.
Australia
The four new Australian projects include light rail lines in Gold Coast, Adelaide, and Newcastle ranging from $67 to $154 million per-mile, and the recent extension of Sydney’s heavy rail system, which was the costliest at-grade project among the new additions at $297 million per-mile. While Australia’s at-grade construction costs are slightly higher on average than the United States, this extension is an outlier. Interviews revealed that this extension suffered from cost and budget overruns due to scoping issues, underbidding by contractors, miscalculated project risks, and the complexities resulting from the line’s intersection with several brownfield sites. This is all despite the country’s simpler governance structure, with transit planning and decision-making concentrated at the state level, less public participation, and fewer cross-jurisdictional issues than the United States. Overall, the costlier new projects reduced the U.S. at-grade cost premium from 46 percent to 40 percent.
Preliminary Takeaways
Our initial construction cost analysis found that the United States pays 46 percent more on a per-mile basis to build primarily at-grade transit projects, and 48 percent more for below-ground lines. When including the disproportionately expensive subway projects recently completed in New York City, the U.S. tunneling premium rises to 247 percent. When comparing project timelines, our data show that at-grade projects in the United States take, on average, 6 months longer to construct, while below-ground projects take more than 16 months longer than similar projects abroad.
Table One: U.S. and Non-U.S. Average Construction Cost Comparison
| Percent Tunneled |
US Avg. Cost |
Non-US Avg. Cost (including new projects) |
U.S. Cost Premium |
| 0-20% |
$119M |
$85M |
40% |
| 20-80% |
$323M |
$257M |
26% |
| 80-100% |
$1.2B ($511B excl. NYC) |
$349M |
246% (46% excluding NYC) |
The new additions to our database are generally in line with the non-U.S. projects in our initial database, with a few notable differences. Average construction timelines have remained largely unchanged, though at an average of 3.9 years, the subway buildouts in Santiago boasted some of the shortest subway construction timelines in our database, second only to Madrid at an average of 3.6 years.
Primarily at-grade lines in this new batch of projects cost $95 million per-mile to build on average compared to $80 million per-mile for non-U.S. projects in the original database, driven primarily by the costlier at-grade projects in Japan and Australia. Overall, the costlier new projects reduced the U.S. at-grade cost premium from 46 percent to 40 percent.
When comparing at-grade projects in the United States to those internationally, it is important to recall that many domestic projects run along freeway or freight rail rights of way. Conversely, international projects tend to run on dedicated right of way along urban boulevards, an inherently more complex and challenging project. As we have concluded before, the U.S. premium might be greater in practice for at-grade projects controlling for this difference.
The average construction costs for mostly below-ground projects in the new batch of projects was higher than the previous international average ($357 versus $346 million, respectively). As a result, the U.S. tunneling premium decreased slightly from 48 to 46 percent (or 247 to 246 percent when including New York City projects). The small change is likely due to the costly tunneled projects in Japan and Germany counterbalancing the low-cost subway lines in Chile.
Overall, the inclusion of construction cost data from 40 new projects from six countries reinforces the key takeaways from Eno’s initial data analysis. While there were slight changes in the U.S. cost premium for at-grade and tunneled projects, the new projects indicate that the United States continues to pay more and take longer to deliver rail transit than peer countries.
But the additional countries and projects can help focus practitioners on where to look for best examples. Tunneling projects in Chile and at-grade light rail in Germany in particular stand out as examples of speedy, low-cost projects. Learning from their successes and applying those lessons here in the United States can help bring the cost premium down.
Preliminary results from this data analysis and research interviews also underscore the importance of strong public sector staff capacity and management skills, a more balanced approach to addressing local demands, and the ability for planners to make prompt, firm decisions about projects. The insights revealed from our expanded scope highlight our previous recommendation that we need to look beyond the United States to identify best practices in governance, decision-making, and project delivery. Additional data analysis and insights on these ten governance case studies will be included in the forthcoming report.