A long-awaited new report from the U.S. Department of Transportation was quietly released last week (two years late) and indicates that the U.S. is already spending enough money on highway capital improvements in the U.S. to maintain the existing system but badly underfunding mass transit state of good repair. The report estimates that all levels of government, collectively, need to increase current spending by about one-third in order to reduce accumulated capital backlog over the next 15 years and improve system performance.
The report is the latest in the “Conditions and Performance Report” series mandated by Congress. The reports are supposed to be biennial but the last report was the 2015 edition. The new C&P report also takes on an additional burden – the report on the national highway freight network that was mandated by the FAST Act is folded into the C&P report as Part III.
Outdated data. The C&P report has become immensely frustrating. It is still the only place where you can find all of the highway and transit system extent, VMT/ridership, capital backlog, current and past funding, and future funding needs estimates, for all levels of government combined, all in one place. And it has some great infographics. But the data the report is based on has become badly outdated.
The 2010 C&P report was based on 2008 data. The 2013 C&P report was based on 2010 data. The 2015 C&P report was based on 2012 data. And now, the 2019 C&P report is delivered two years late and is based on 2014 data. For almost any of the data points cited in the report for the year 2014, you can find much more recent data points in Highway Statistics 2017 (or 2018) or in the National Transit Database.
Sometimes this delay renders whole swaths of the C&P analysis essentially worthless. Take, for example, the report’s extrapolation of future mass transit capital funding needs. The report attempts to estimate how much additional transit capital spending would be needed in the coming decades to address future needs, and uses two scenarios modeling future transit ridership demand – a low-growth scenario where ridership grows by 1.2 percent per year, and a high-growth scenario where ridership grows by 1.8 percent per year (because the 15-year growth trend from 2000-2014 was 1.5 percent per year).
But 2014 is the base year, and herein lies the problem. Here is footnote 9 from page 7-15: “The Low-Growth and High-Growth scenarios in this report are based on 15-year ridership trends as of 2014, the cut-off year for this report. The Department does note that transit ridership has, in fact, not increased since 2014 through the early months of 2019. The causes of the decreased transit ridership since 2014 will be analyzed in the next edition of this report. The ridership trends since that time will also be incorporated into the capital investment needs forecasts presented in future editions of this report.”
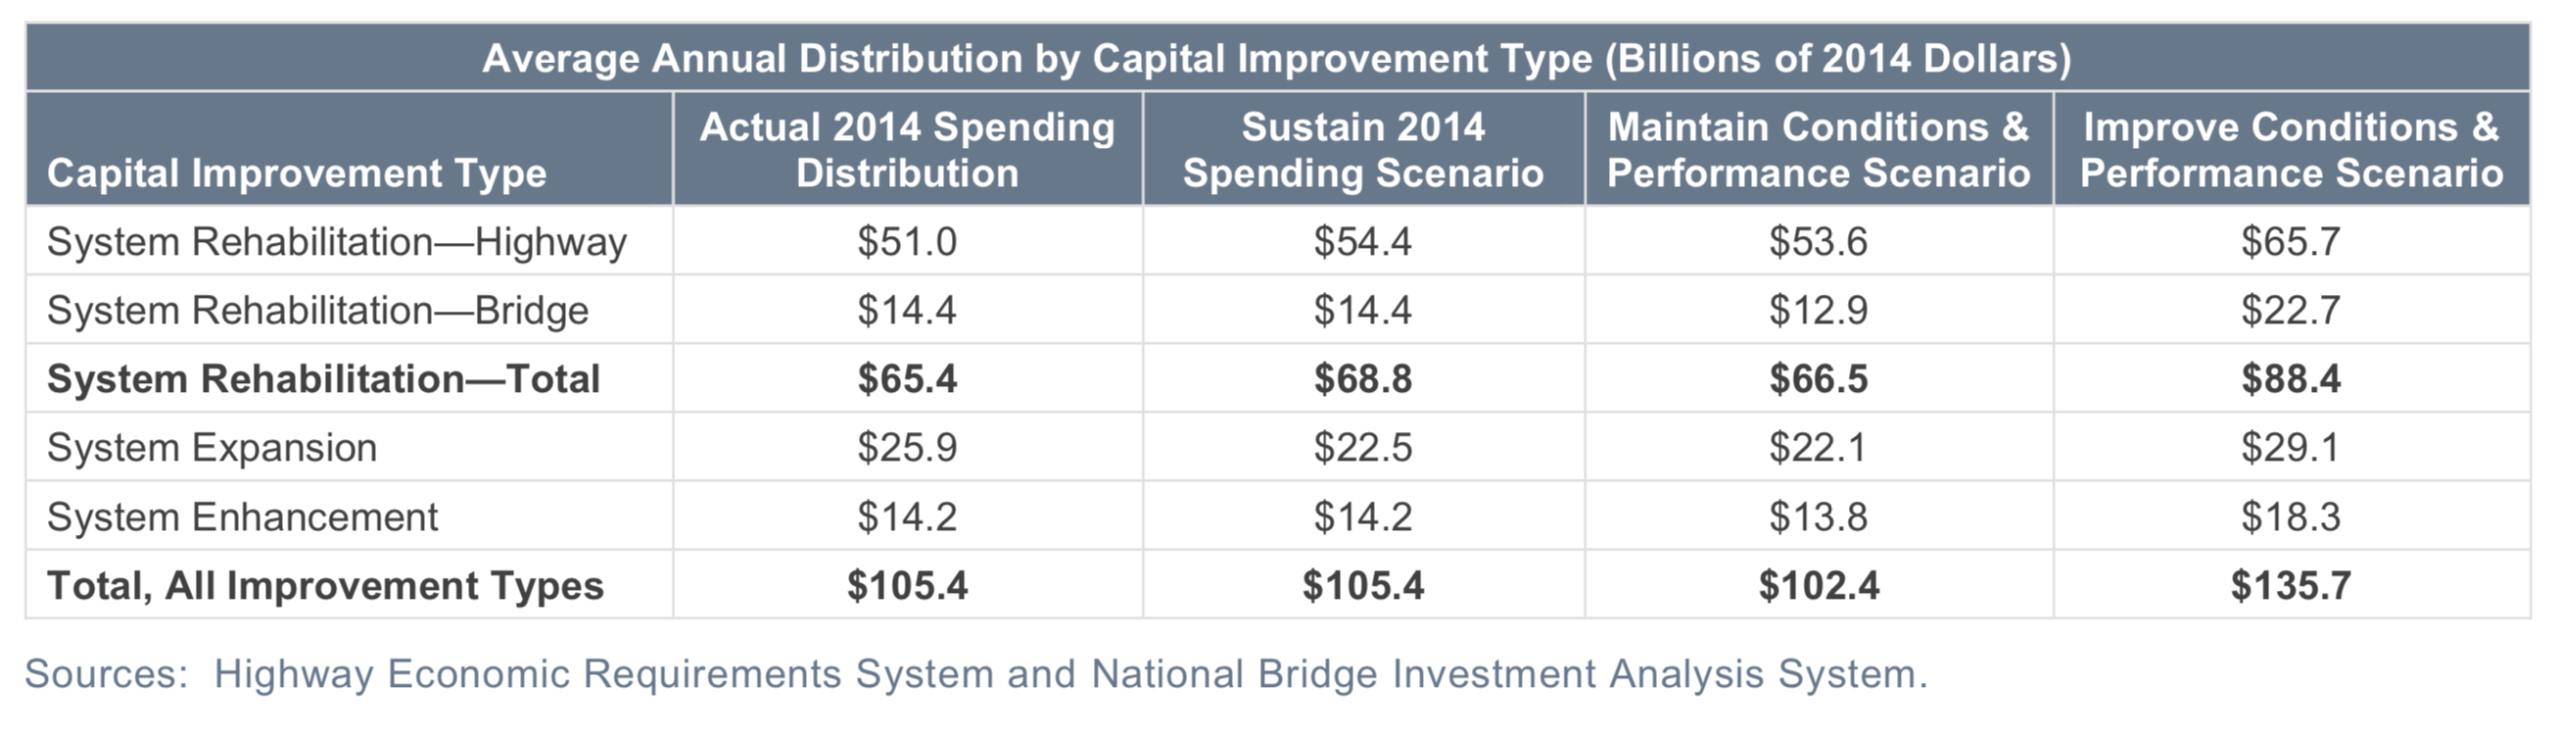
Highway spending. For 2014, the base year, all levels of government collectively spent $105.4 billion on highway capital projects (see a state-by-state breakdown here). The C&P report estimates that the amount of annual spending by all levels of government needed to maintain current (as of 2014) highway conditions and performance for 20 years (the “level of capital investment at which selected measures of future conditions and performance in 2034 are maintained at 2014 levels” – average pavement roughness and percentage of bridges in poor condition staying the same) was only $102.4 billion in 2014 dollars, so at that time, governments were already spending more than needed just to keep treading water.
Then there was an “improve conditions and performance” scenario, which for highways, meant reducing average pavement roughness by 5.6 percent, upgrading nearly all of the poor condition bridges, and addressing “all potential investments estimated to be cost‐beneficial.” The 20-year cost of this scenario averages $30.3 billion per year higher than actual 2014 spending (in 2014 dollars), or $606 billion over the 20-year span of the scenario.
Some of this increase is already underway. In fiscal 2019, the new budget authority granted by Congress to the Federal Highway Administration (excluding emergency relief) was $49.3 billion, a 20 percent increase over FY 2014. But actual cash out the door of FHWA (outlays) was only $45.5 billion, which was only a 5 percent increase over 2014. The point being that, once these significant funding increases start getting spent out, and if state and local spending follows pace, we could already be well on the way to reducing the highway capital backlog.
Interestingly, traffic delays are expected to decrease under all of the scenarios, by nearly the same amounts – under their assumptions, “travel growth gradually slows over time and various highway management and operational strategies are adopted more broadly.”
It should be noted that funding for highway system expansion is assumed in all of the scenarios as well, to varying degrees:
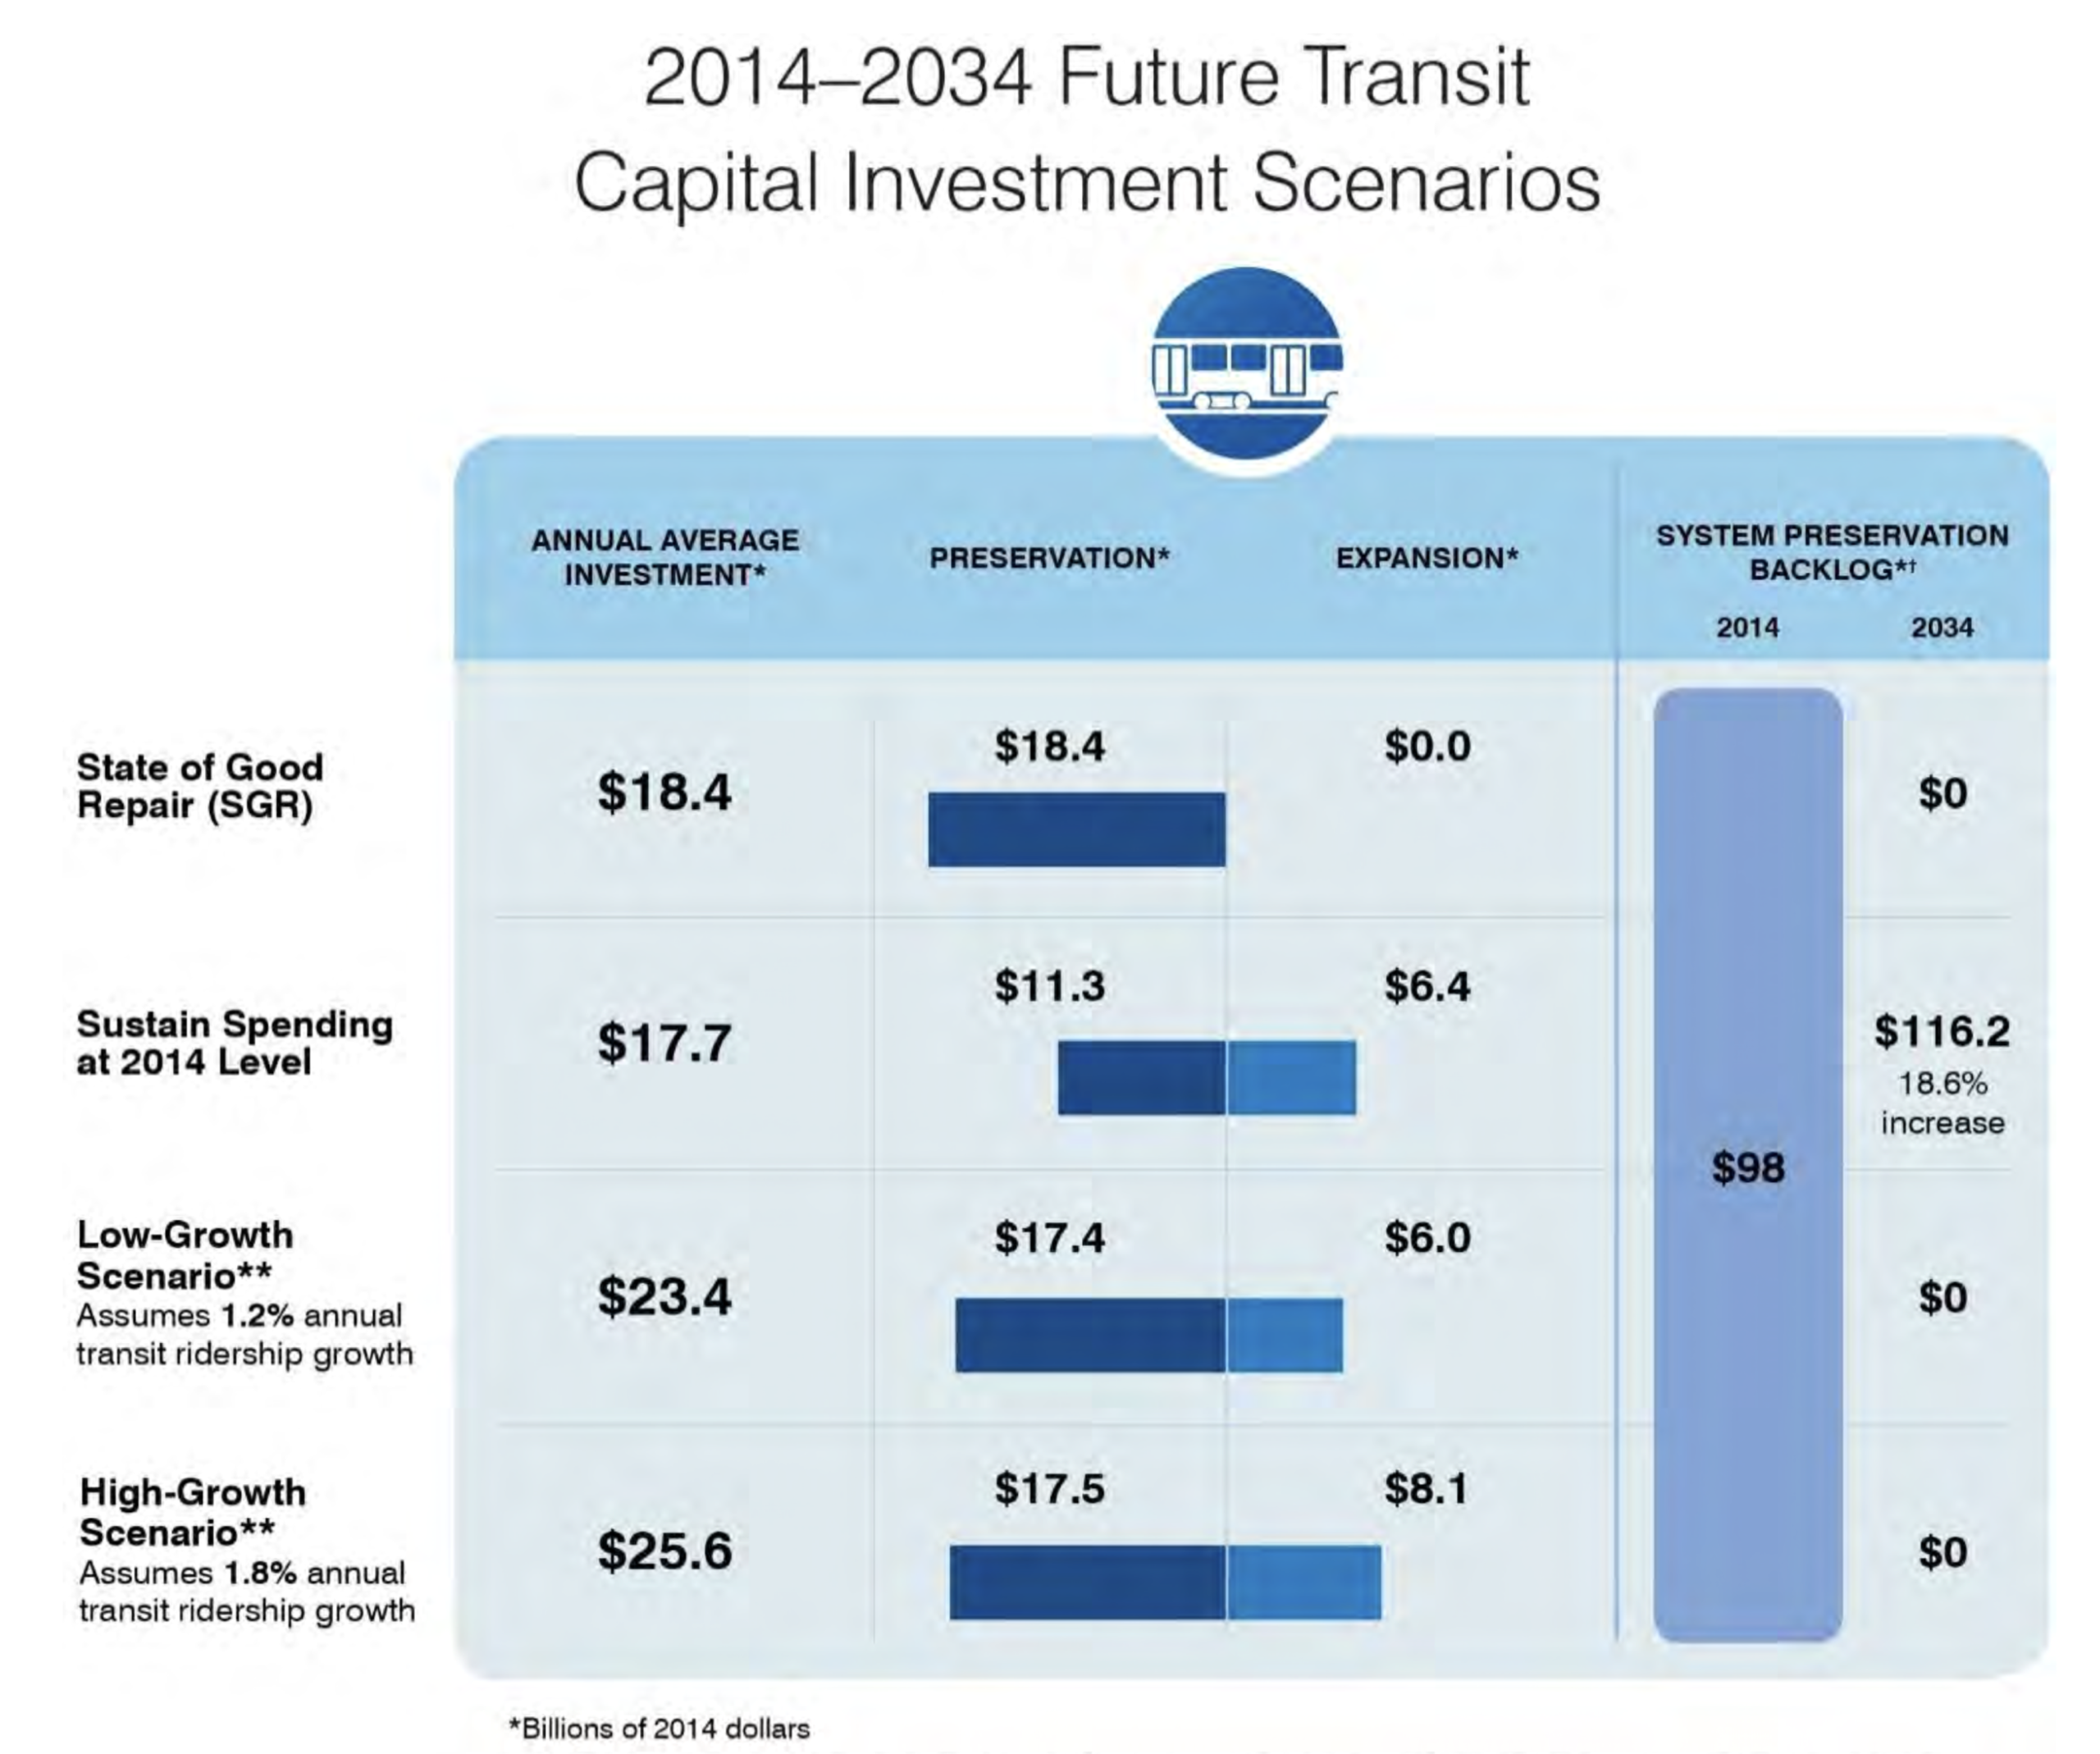
Mass transit spending. The situation is much different – and much worse – for mass transit. For 2014, all levels of government collectively spent $17.7 billion on mass transit capital – $11.3 billion on maintaining the existing system in a state of good repair (SGR) and $6.4 billion on system expansion. The new report estimates that the amount of annual funding in 2014 dollars needed to maintain “state of good repair” (defined in the report as “all transit capital assets being within their useful service life”) averages $18.4 billion per year over 20 years. In other words, current spending on SGR needs to increase by about 63 percent over 2014 levels in order to keep the systems from decaying.
That’s $142 billion over 20 years above the 2014 levels, $98 billion of which is the existing (as of 2014) system preservation backlog.
Then we have the scenarios that assume various increases in transit ridership, all of which are (based on the last 5 years) wildly off base, which will likely lower the 20-year ridership increase to below the “low” scenario. And the low growth scenario called for an average of $6.0 billion per year in 2014 dollars for mass transit expansion – less than the $6.4 billion actually spent in 2014.
The unavoidable conclusion is that American government, collectively, is woefully underfunding mass transit maintenance and capital backlog, but may actually be in the right ballpark on funding transit expansion, and if total transit spending is constrained, a shift in emphasis from new capacity to SGR is probably warranted.
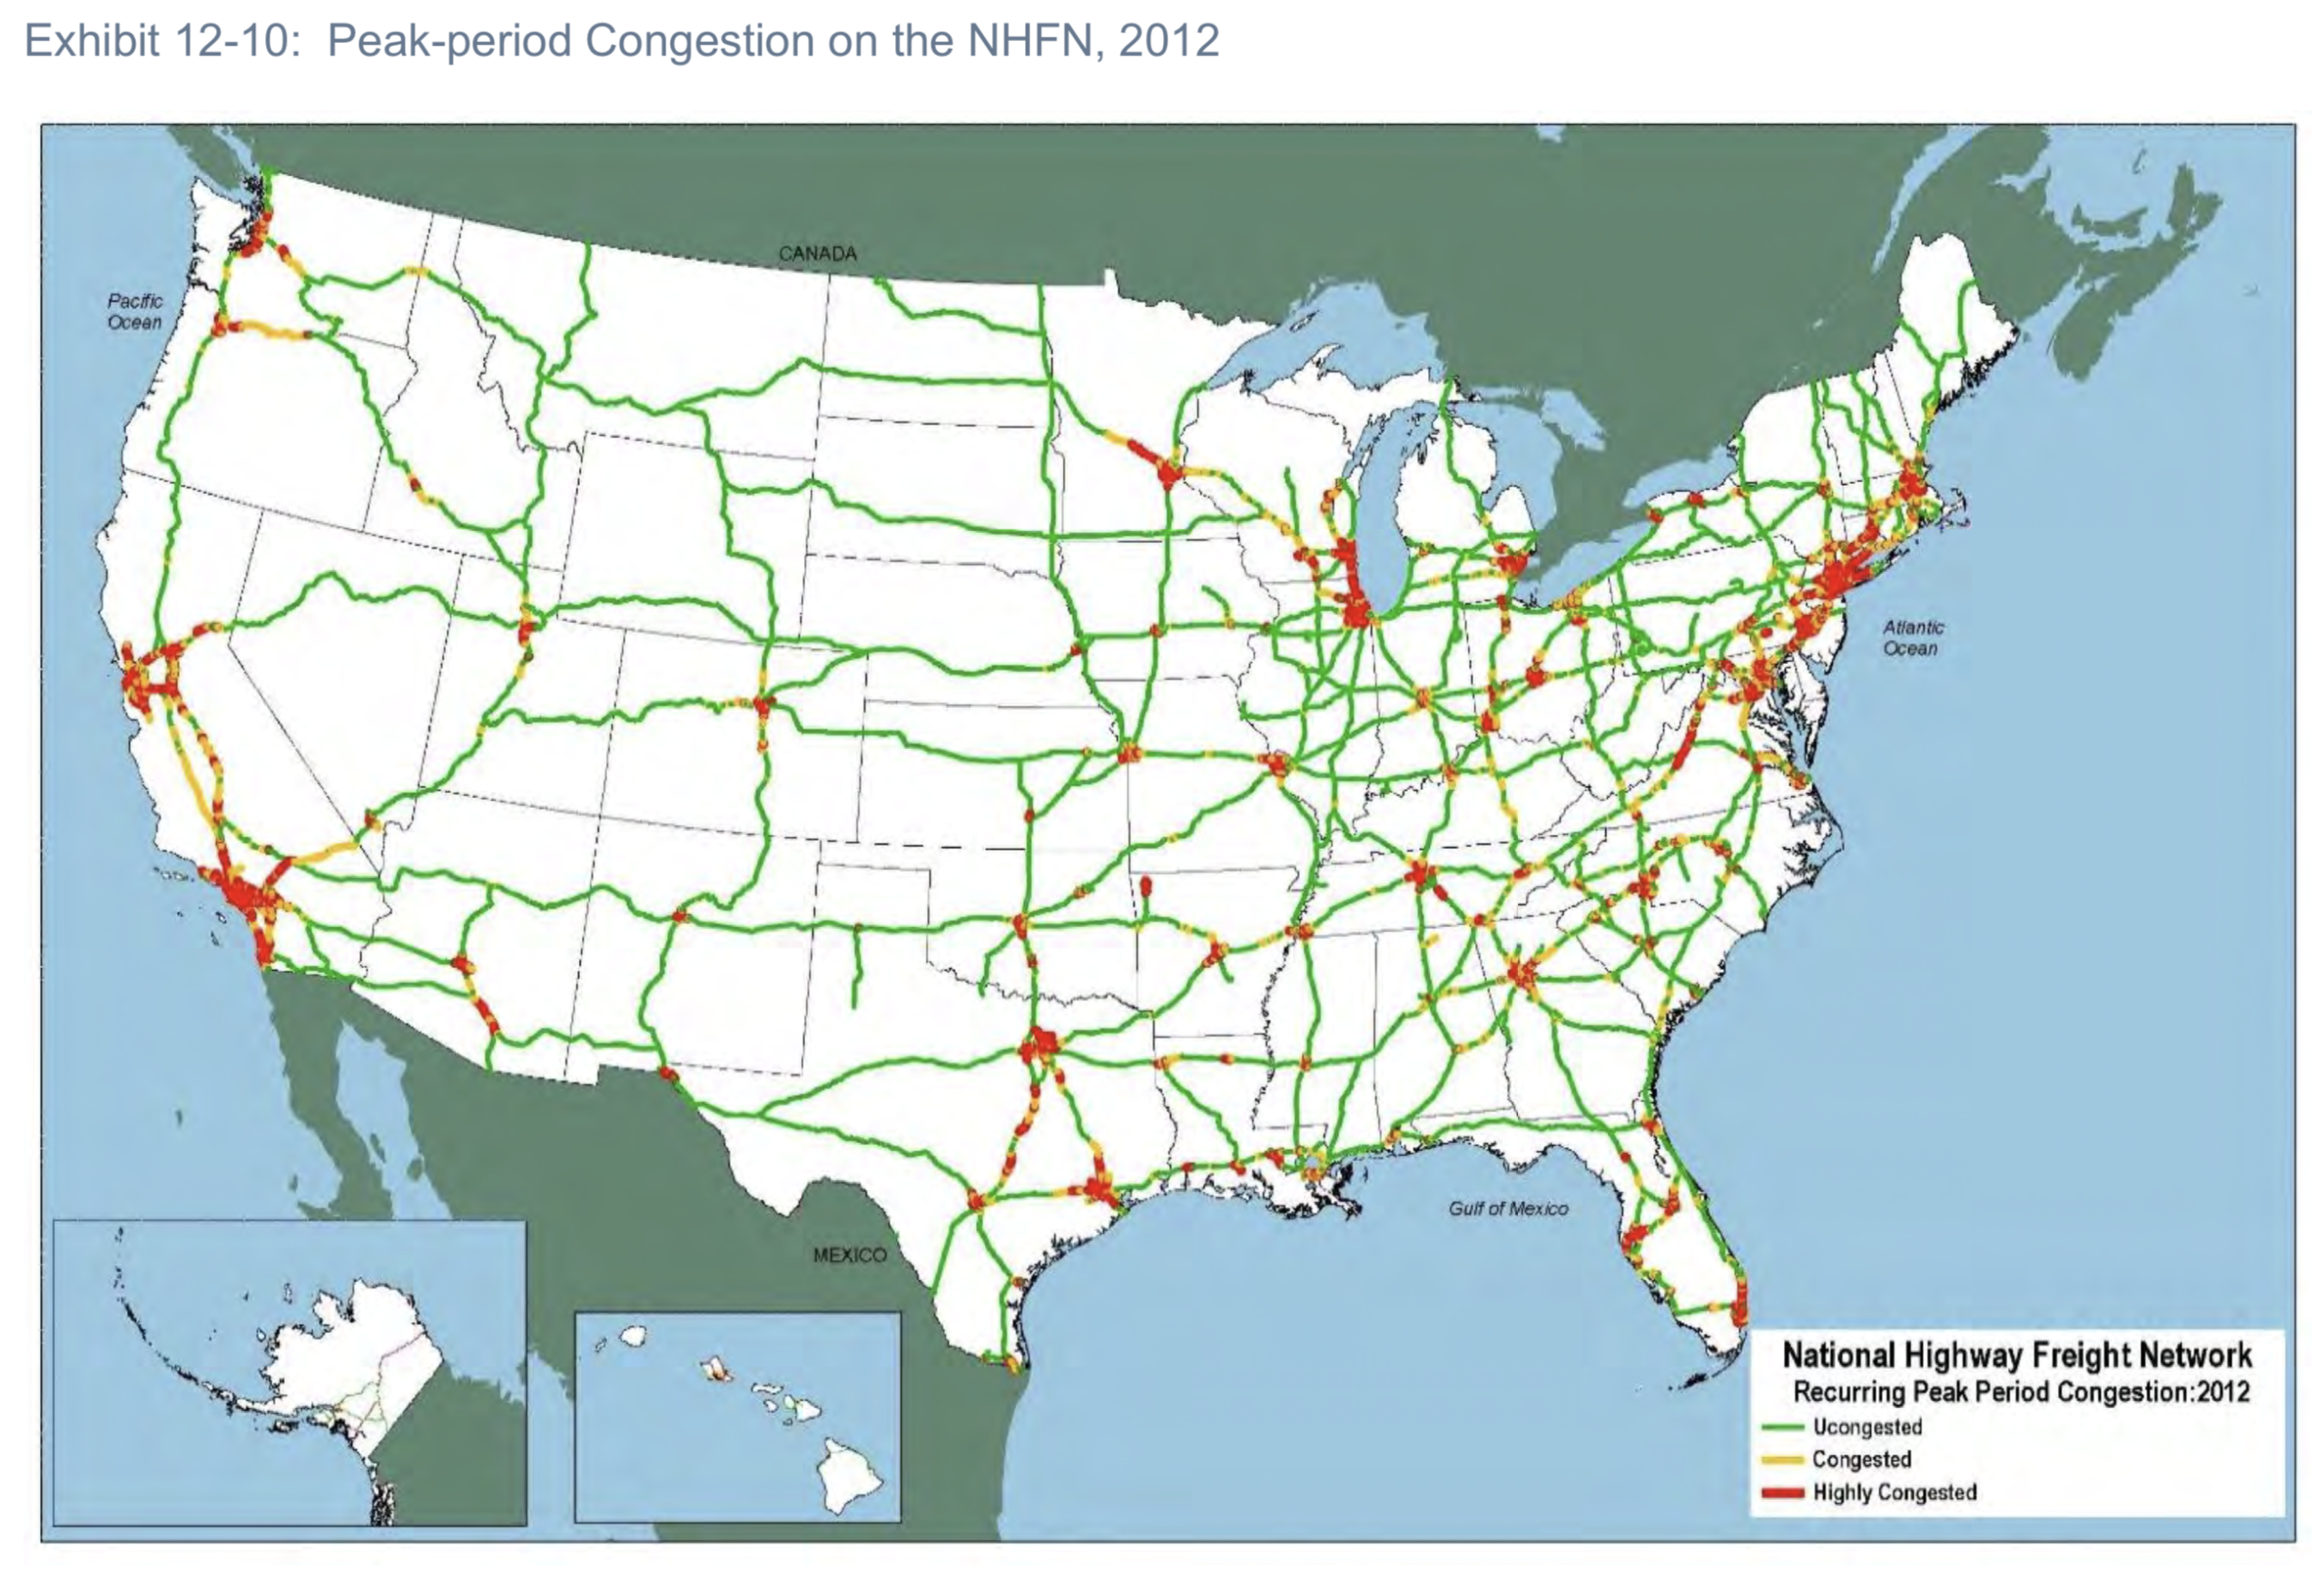
Freight. Part III of the new report contains the report on the conditions and performance of the National Highway Freight Network (NHFN) mandated by the FAST Act.
Key takeways include:
- “Pavement [roughness] was acceptable on 96 percent of the NHFN roadways, based on 2014 data.
- “Nearly one-third of the bridges on the NHFN are 51 years or older, based on 2014 data.
- “The number of crashes and fatalities on the NHFN increased from 2014 to 2015, by 5.7 percent and 6.1 percent respectively, based on 2015 data.
- “Travel time has become less predictable over the last 5 years, with the Travel Time Reliability Planning Time Index increasing in 14 of the top 25 intercity truck corridors, based on 2011–2014 data.
- “Average travel speed has decreased in 13 of the top 25 freight-significant corridors, based on 2011–2015 data.”
The new report has some good analysis of congestion on the NHFN, which is largely confined to urban areas except for key segments in Virginia, California, Oregon, and Texas: