December 11, 2018
Today, Transportation Secretary Elaine Chao announced the full list of recipients of $1.475 billion in fiscal year 2018 funding for 91 individual grants under the Department’s BUILD surface transportation grant program (formerly known as TIGER grants).
“BUILD transportation grants are major investments in road, rail, transit, and port projects that serve as a down payment on this administration’s commitment to America’s infrastructure,” said Chao.
Video of the announcement event can be viewed here.
Members of Congress were notified of grants in their districts or states late last week, so announcements of individual grants have been trickling out via press releases from the offices of those legislators over the past few days.
This is the tenth annual round of grants under this program, which came into existence in the fiscal 2009 ARRA stimulus act. A total of almost $7 billion in funding has been distributed to date.
- An ETW list of all projects in alphabetical order (by state) with the project name, sponsor, grant amount, total project cost, BUILD share, mode (as assigned by DOT), project description, and urban/rural classification is here;
- A list from USDOT list that also contains a one-page fact sheet for each project (which includes a picture or map of each) is here; and
- For context, an ETW table showing all cumulative TIGER/BUILD grant award totals from FY 2009-2018 (in dollars and in percentage shares ) is here.
Congressional support. This year’s BUILD announcement was unique in that the chairman and ranking members of the House and Senate Transportation-HUD appropriations subcommittees were there on the dais with Sec. Chao. The Secretary remarked that “you cannot imagine what a big deal it is to get the Big Four here at the same time on the same dais.” Senators Susan Collins (R-ME, $26.6 million), Jack Reed (D-RI, $20.0 million), and Representatives Mario Diaz-Balart (R-FL, no money precisely in his district but $9.5 million in the adjacent district), and David Price (D-NC, $20.0 million) all spoke in support of the BUILD program.
In the past, there has been some Congressional dissatisfaction with the way that DOT was administering the program, but by having all four corners of the transportation budget approval process on stage together, implicitly endorsing this year’s list, things are looking up in that regard.
Much more funding. The FY18 funding level is triple the FY17 grant total of $487 million, an increase made possible by the massive discretionary appropriation increases allowed by the February 2018 bipartisan budget deal.
The program will probably shrink somewhat in 2019 compared to this year – the pending House version of the FY19 appropriations bill has $750 million for the program and the pending Senate version has an even $1 billion.
(Ed. Note: If DOT is thrown into a year-long continuing resolution at fiscal 2018 funding levels, as became more likely after today’s Trump-Pelosi-Schumer meeting at the White House, that would actually be better for total BUILD grant funding than would a year-long new FY 2019 bill.)
Still oversubscribed. Even though the program got $1.5 billion in 2018, Deputy Secretary of Transportation Jeff Rosen said that there were a total of 851 applications this cycle that asked for a total of over $11 billion in BUILD funding. (91 grants out of 851 applications would be a 9.6 acceptance rate – Ivy League acceptance rates.)
Spreading dollars as widely as possible. Like the Trump Administration’s fiscal 2017 BUILD grant announcements, the 2018 grants continue to distribute the money to as many states as possible. Last year, 41 different states received grants, and this year, the larger funding level allows 49 states and the District of Columbia to receive grants (the only state left out this time is Hawaii).
As we pointed out last year, spreading a grant program over as many states as possible is a very Senate-centric way to run the program.
Bigger grants. Tripling the size of the program has also increased the size of most grants. The average 2018 grant size ($1.475 billion divided by 91 grants) is $16.2 million and the median grant size (the number closest to the middle of the list once all the grants are ranked in order by size) is $19.4 million. In fiscal 2017, the average grant size was $11.9 million and the median grant size was $10.2 million.
This means that the average grant size in 2018 is 63 percent higher (+$7.5 million) than it was in 2017, and the median grant size is 59 percent higher (+$6.0 million).
The 2018 appropriations law set a maximum grant size of $25 million, and twelve of this year’s grants were the maximum allowable amount (Arkansas I-49, Arizona SR 260, Jacksonville FL urban core, Kentucky SR 461, Louisiana I-12 widening, Missouri U.S. 169, Mississippi SR 19, New York City Brooklyn Bridge masonry, South Carolina upstate express corridor, Texas SH 137 and Texas SH 302-SH 115 interchange).
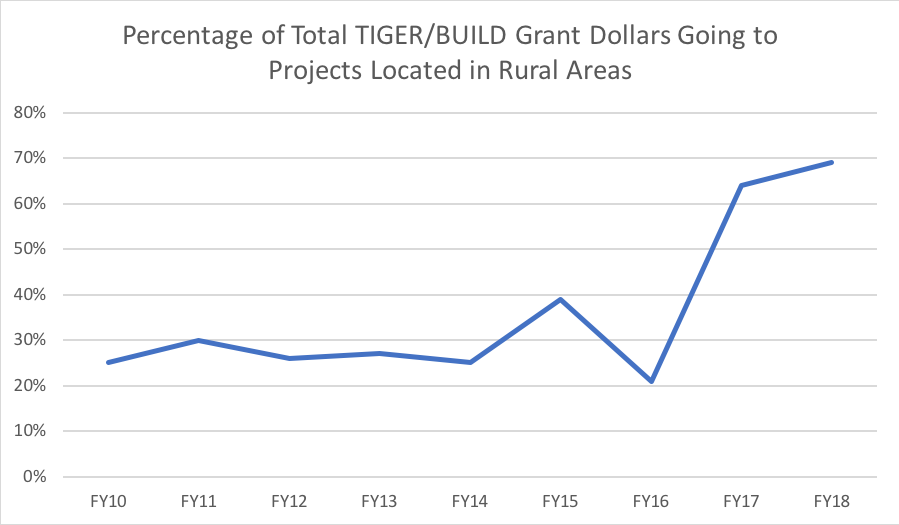
Rural grants rule. The FY 2017 round of BUILD grants put 64 percent of the grant money towards grants in located in rural areas, more than double the 28 percent average of program funding that went to rural areas over the FY 2010-2016 period.
For the FY 2018 grants, that rural percentage goes even higher, to 69.6 percent of total funding. (The FY 2018 appropriations act only specified that “not less than 30 percent” of total funding had to go to projects in rural areas – which is obviously a floor, not a ceiling – and the law also said that the Secretary “shall take such measures so as to ensure…an appropriate balance in addressing the needs of urban and rural areas,” so I suppose we know what this Administration considers “appropriate” in that regard.)
| Rural |
$1,027,306,268 |
69.6% |
| Urban |
$447,726,188 |
30.4% |
| TOTAL |
$1,475,032,456 |
100.0% |
In her remarks, Secretary Chao said that the Administration was attempting to ““rebalance underinvestment in rural communities to address overlooked needs.”
(Ed. Note: This seems like a good place to mention that there is no consistent definition of the terms “urban” and “rural” for USDOT grant programs. For the BUILD program, “rural” is defined as being located outside an urbanized area, and the Census Bureau defines an urbanized area has having a minimum population of 50,000. But the TIFIA credit program has a statutory definition of “rural” (in 23 U.S.C. §601(a)(15)) meaning outside an urbanized area with a population of at least 150,000. And the INFRA grant program has a statutory definition of “rural” (in 23 U.S.C. §117(i)(3)) meaning outside an urbanized area with a population of at least 200,000. So if the exact same grants announced today had been made under the INFRA program instead of the BUILD program, the rural percentage might have been a good bit lower.)
Regional diversity. The FY 2018 law directed the Secretary to “ensure an equitable geographic distribution of funds,” and to that end, they break the country down into four regions, which received the following grant totals today:
| East |
$244.0 |
16.5% |
| Central |
$413.5 |
28.0% |
| South |
$521.0 |
35.3% |
| West |
$296.5 |
20.1% |
An interactive map of the 91 projects given FY 2018 awards is here.
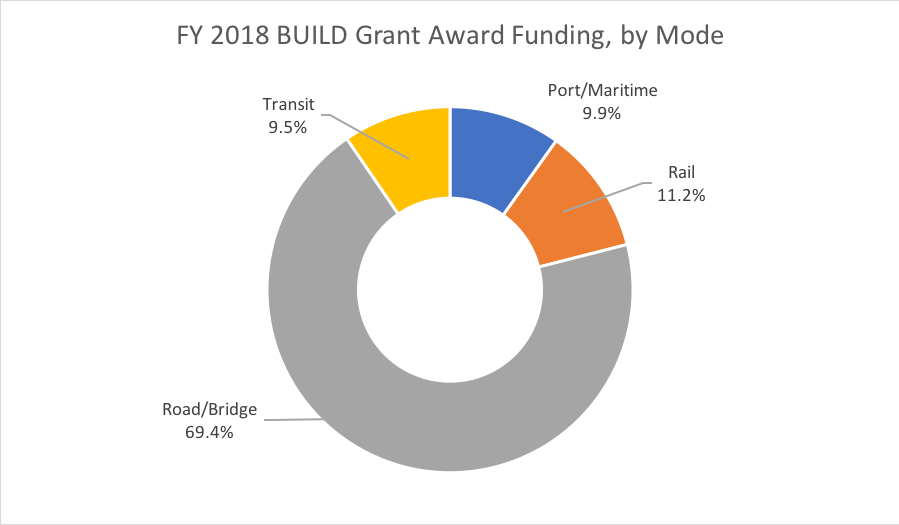
Roads and bridges continue to dominate. Despite the fact that BUILD grants are completely funded out of the general fund of the Treasury, and are thus exempt from the whole “projects that benefit highway users deserve x percent of funding” arguments that have always accompanied projects funded out of the Highway Trust Fund, the Trump Administration continues to prioritize road and bridge projects above other modes. In terms of total FY18 dollars, road and bridge projects received 69.4 percent of total funding, with mass transit projects getting 9.5 percent, port/maritime projects receiving 9.9 percent, and rail projects getting 11.2 percent of the total.
|
Grant Awards |
Pct. |
| Port/Maritime |
$145,558,836 |
9.9% |
| Rail |
$164,565,087 |
11.2% |
| Road/Bridge |
$1,024,211,535 |
69.4% |
| Transit |
$140,696,998 |
9.5% |
| TOTAL |
$1,475,032,456 |
100.0% |
The last time the Obama Administration publicized the modal breakdown in its TIGER grant selections was FY 2015, in which road/bridge projects got 30 percent of the money, mass transit 29 percent, freight rail 14 percent, passenger rail 10 percent, maritime 9 percent and bike/ped 7 percent.
However, the project descriptions for several of the road/bridge projects announced today do have bicycle, pedestrian, and/or “complete streets” elements listed, which blurs the modal boundary lines somewhat. And, in particular, the $25 million grant for Jacksonville, Florida is classified as being entirely a transit project by the DOT head office, but the FTA Twitter account split it up into two $12.5 million projects, one of which is purely transit and the other of which seems mostly road/bridge.
And, even though there were no specifically intercity passenger rail grants this time, the Philadelphia 30th Street Station project (classified as transit) would also be used by Amtrak, and the Springfield, Illinois freight rail project would also have some Amtrak usage.
(Ed. Note: Bicyclists and pedestrians are not the only nonmotorized highway users. Hence the $9.65 million grant for Geauga County, Ohio (home of the fourth-largest Amish community in the U.S.) “to address conflicts between motorized vehicles and non-motorized buggies, including increasing shoulder widths over approximately 7 miles to create non-motorized buggy lanes; implementing advanced detection system to alert motorists of oncoming buggies; installing conflict warning systems with flashing beacons; post school zone signs, and adding pedestrian warning signs/ beacons on roadways.”)
(Further Ed. Note: I live in Front Royal, Virginia (Gateway to Skyline Drive! Canoe Capital of Virginia! Home of the Virginia Beer Museum!), which got a $15.5 million BUILD grant this week that is classified by USDOT as being a port/maritime grant. But it’s for the Virginia Inland Port, a rail terminus for a dedicated line from the Port of Hampton Roads, 220 miles away. The project appears to be mostly a better rail grade crossing with U.S. 522 and some other rail line relocations, and it’s a long way from the ocean.)
No planning grants. The initial FY 2009 TIGER grants were all about shovel-ready construction. The fiscal 2010 appropriations law, and the fiscal 2o14 law, also allowed a limited amount of TIGER funding to go towards grants for planning activities for projects that were not construction-ready. (ETW did not include those in our cumulative stats because the planning grants were so small and would have required too many rows in our spreadsheet – see the 2010 and 2014 planning grant lists.) The fiscal 2018 law provided that “ the Secretary may use an amount not to exceed $15,000,000 for the planning, preparation or design of projects eligible for funding under this heading.” But “may” is not “shall,” and apparently the Administration did not choose to make any planning-only grants using the FY18 funding.
State totals. With $1.475 billion to go around, and with the maximum size of a single grant capped at $25 million, the funding could go a long way. The appropriations law did specify that “not more than 10 percent of the funds made available under this heading may be awarded to projects in a single State” which presumably limits a single state’s total FY18 take to $150 million (the gross amount of the appropriation before the administrative overhead set-aside).
No state got to $150 million. The closest was Texas, which got five projects totaling $104 million ($7.1 percent of the post-takedown $1.475 billion). The smallest grant was $1.3 million for a project in New Mexico.
FY 2018 BUILD Grant Awards, by State (Ranked)
|
| Texas |
$104,050,000 |
7.1% |
|
South Carolina |
$25,000,000 |
1.7% |
| California |
$72,500,000 |
4.9% |
|
Tennessee |
$25,000,000 |
1.7% |
| Missouri |
$65,386,193 |
4.4% |
|
Georgia |
$24,821,050 |
1.7% |
| North Carolina |
$60,092,608 |
4.1% |
|
Montana |
$22,750,000 |
1.5% |
| Kentucky |
$59,520,000 |
4.0% |
|
Delaware |
$22,249,850 |
1.5% |
| Colorado |
$47,007,562 |
3.2% |
|
Iowa |
$22,018,957 |
1.5% |
| Arkansas |
$45,000,000 |
3.1% |
|
Illinois |
$22,000,000 |
1.5% |
| Louisiana |
$41,422,000 |
2.8% |
|
Dist. of Col. |
$20,000,000 |
1.4% |
| Michigan |
$40,700,000 |
2.8% |
|
Minnesota |
$20,000,000 |
1.4% |
| Ohio |
$40,504,192 |
2.7% |
|
Nebraska |
$20,000,000 |
1.4% |
| Indiana |
$40,000,000 |
2.7% |
|
Rhode Island |
$20,000,000 |
1.4% |
| West Virginia |
$40,000,000 |
2.7% |
|
Vermont |
$20,000,000 |
1.4% |
| Oregon |
$39,414,875 |
2.7% |
|
Wyoming |
$20,000,000 |
1.4% |
| Mississippi |
$38,000,000 |
2.6% |
|
Washington |
$19,966,982 |
1.4% |
| Pennsylvania |
$35,000,000 |
2.4% |
|
Kansas |
$19,901,427 |
1.3% |
| Florida |
$34,500,000 |
2.3% |
|
Wisconsin |
$19,757,899 |
1.3% |
| Alaska |
$32,342,722 |
2.2% |
|
Idaho |
$15,704,700 |
1.1% |
| South Dakota |
$28,702,731 |
1.9% |
|
Virginia |
$15,500,197 |
1.1% |
| Alabama |
$28,222,671 |
1.9% |
|
North Dakota |
$15,000,000 |
1.0% |
| Oklahoma |
$26,664,460 |
1.8% |
|
Connecticut |
$9,160,000 |
0.6% |
| Maine |
$26,639,800 |
1.8% |
|
Utah |
$7,994,000 |
0.5% |
| Maryland |
$26,554,575 |
1.8% |
|
New Hampshire |
$7,504,854 |
0.5% |
| Massachusetts |
$26,206,403 |
1.8% |
|
New Jersey |
$5,660,000 |
0.4% |
| Arizona |
$25,000,000 |
1.7% |
|
Nevada |
$5,319,838 |
0.4% |
| New York |
$25,000,000 |
1.7% |
|
New Mexico |
$1,291,910 |
0.1% |
When comparing these state shares to past years, one can look at the Obama Administration cumulative total (over fiscal years 2009-2016) with the Trump Administration total to date over fiscal years 2017-2018. The states at the top of the lists under Obama don’t fare as well under Trump, and only part of that can be explained by the fact that the money is being distributed more widely…
| Obama Top Five TIGER States (Shares) |
|
Trump Top Five BUILD States (Shares) |
|
Obama |
Trump |
|
|
Obama |
Trump |
|
FY09-16 |
FY17-18 |
|
|
FY09-16 |
FY17-18 |
| California |
8.1% |
4.2% |
|
Texas |
4.5% |
5.8% |
| Illinois |
6.5% |
1.8% |
|
California |
8.1% |
4.2% |
| New York |
5.7% |
1.4% |
|
N. Carolina |
2.6% |
4.1% |
| Washington |
4.8% |
1.5% |
|
Kentucky |
1.7% |
3.4% |
| Texas |
4.5% |
5.8% |
|
Missouri |
2.3% |
3.3% |
Federal share. The appropriations act required that “the Federal share of the costs for which an expenditure is made under this heading shall be, at the option of the recipient, up to 80 percent” but that for projects in rural areas, “ the Secretary may increase the Federal share of costs above 80 percent.”
The $1.475 billion in FY 2018 grants went towards projects with an estimated total cost of $4.322 billion, for an average BUILD cost share of 34.1 percent.
The median cost share of the 91 projects on the list is 50 percent, a cost share level shared by nine different projects.
Four projects got a federal share of 100 percent: Alaska Nenana bridge, Iowa Siouxland regional transit, the Sedalia, Missouri rail spur, and the road project in Millard County, Utah.
Five other projects received a BUILD cost share of over 80 percent but less than 100 percent: Sault St. Marie, Michigan Carbide Dock Port (95.4%), Emmonak, Alaska port (85.3%), Yavapai County, Arizona SR 260 (85.3%), Maryville, Missouri South Main Corridor (84.0%), and Brazos Transit District, Texas bus replacement (80.3%).
On the other end of the spectrum, three projects got a federal BUILD grant cost share of less than 10 percent:
- Colorado Interstate 25, Phase 2 ($20 million BUILD grant towards $250 million project costs = 8.0%);
- Minnesota I-35/I-53 Twin Ports Interchange Reconstruction ($20 million BUILD grant towards $266.7 million in project costs = 7.5%); and
- The Brooklyn Bridge masonry arches rehab project in NYC ($25 million BUILD grant towards $337.6 million in project costs = 7.4%).
Leaders and chairs taken care of. The fact that 49 states got at least one BUILD grant this year means that only two Senators (from Hawaii) were left out. But the fact that Kentucky had the fifth-highest total take ($59.5 million) might have something to do with the fact that it’s Senate Majority Leader Mitch McConnell’s (R-KY) home state.
For House Republicans, outgoing Majority Whip Steve Scalise (R-LA) was the big winner, with two grants totaling $41.4 million in his district. Outgoing Republican Conference chairwoman (the #4 slot in the majority leadership) Cathy McMorris Rodgers (R-WA) also got two grants, totaling $20 million. The new ranking Republican on the Transportation and Infrastructure Committee, Sam Graves (R-MO), got a $10.4 million road grant.
Democrats were not left out. The incoming Speaker (presumably), Nancy Pelosi (D-CA), got a $15 million project in her district, enabling her to issue a congratulatory press release. The incoming chairman of the Transportation and Infrastructure Committee, Peter DeFazio (D-OR), got a $20 million rail grant in his district for the Coos Bay rail line. As mentioned above, David Price (D-NC), the incoming chairman of the Transportation-HUD appropriations subcommittee, got $20 million for a new bus facility in his district.
Republican House districts favored. The fact that 49 states got awards makes partisan analysis of the grants difficult from a Senate point of view. But when looking solely at the U.S. House district distribution of the FY 2018 funds, it appears that 70 percent of the money went for projects located solely in a Republican House member’s district. 25 percent of the money went for projects located solely in a Democratic district, and the other 5 percent went to projects that distributed funding on a statewide basis or, in one instance, was split between a Republican district and a Democratic district.
(Ed. Note: If politics had been the primary goal, it would have made sense to announce the grants for Jeff Denham (R-CA – $20 million), David Valadao (R-CA – $17.5 million), Kevin Yoder (R-KS – $13.8 million), David Young (R-IA – $11.2 million), Jared Poliquin (R-ME – $11.0 million), Thomas MacArthur (R-NJ – $5.7 million) and Rod Blum (R-IA – $3.8 million) before the midterm elections – all of those guys just lost their seats. And the $50 million that Will Hurd (R-TX) got from two grants in his district might have helped him win re-election by more than the 1,150 votes with which he triumphed in his squeaker of a re-election campaign.)

