Counterintuitive: What If Access to Dedicated Revenues Actually Holds You Back?
50 years ago this month, the biennial highway reauthorization bill was on its way to defeat for the first time. The cause was the demand by urban interests (finally empowered in the House of Representatives by the Supreme Court’s 1960s one-person, one-vote decisions) for access to Highway Trust Fund revenues for local mass transit expenses.
The dispute killed the 1972 highway bill, but transit interests came back in the next Congress and finally got authority for highway money to be flexibly used for certain transit capital projects on a year-by-year, case-by-case basis. But the fight continued until December 1982, when urban interests agreed to support a huge gasoline and diesel tax increase in exchange for a permanent, dedicated portion of the Trust Fund, called the Mass Transit Account. (See here for the full story.)
Since then, mass transit has been entitled to 20 percent of the proceeds of the 1982, 1990 and 1993 gasoline and diesel tax increases (2.86 cents per gallon today), plus a variable amount of regular appropriations from the general fund each year, plus whatever money gets “flex” transferred under the 1973 rules on a project-by-project basis.
But what if the great mass transit victory of 1982 – access to a permanent, dedicated stream of revenues for mass transit, out of the same trust fund that had built the Interstate system – actually wound up holding back the transit program?
As counterintuitive as it sounds, the numbers are real and somewhat surprising. Using the Congressional Budget Office’s downloadable dataset from their Public Spending on Transportation and Water Infrastructure, 1956 to 2017 report, go to sheet W-2, and and add up total federal spending on highways and mass transit over that period. Then, all you do is divide the total number by the transit number* to get a sense of relative preference by policymakers for highway spending’s relative importance versus mass transit spending. (The numbers are in outlays, which are the cash going out the Treasury door, so they lag the spending decisions made by Congress and the Administration by several years.)
![]()
Going from left to right, you can see how there was no federal mass transit program until FY 1962, and the funding was de minimis (less than 1 percent of total highway-transit spending) through 1967. A funding increase in a 1968 law, followed by a massive increase in a 1970 law, took transit outlays past 10 percent of total highway-transit funding in 1974. Then, the passage of the Congressional Budget Act of 1974 banned the creation of new multiyear contract authority drawn from the general fund – but not before Congress gave tons of it to mass transit during the transition period before the Budget Act took full effect in January 1975.
As the massive amount of 1970-1974 multi-year general fund contract authority for transit was “spent down” in the late 1970s, the Appropriations Committees started picking up the slack with larger and larger annual appropriations from the general fund. The combination of this money peaked in fiscal year 1982, when transit outlays were 32.2 percent of total highway-transit funding. This was the year before the creation of the Mass Transit Account in the Highway Trust Fund (even though the law is called the Highway Revenue Act of 1982, it was signed into law in early January 1983).
Creation of the Mass Transit Account was followed by a sharp decrease in transit’s share of total highway-transit funding throughout the 1980s, stabilizing at around 20 percent of total highway-transit outlays in fiscal 1985. Here are the numbers year-by-year:
![]()
We pondered several causes for this. We looked at annual Trust Fund receipts in Table FE-210 to see if growth in trucking taxes vis-a-vis fuel taxes had caused the Transit Account’s share of total receipts to shrink noticeably (not the case). We also checked to see if the fact that the Highway Account was still earning lots of interest on its balances in 1983 when the Transit Account had no balances was a problem (not really).
The answer seems to lie with the Appropriations Committees.
We downloaded the latest Public Budget Database from OMB and then added up all of the budget authority provided by Congress for the Federal Transit Administration and its UMTA predecessor going back to fiscal 1981 and then split the total up into Trust Fund contract authority versus regular appropriations. (The budget database goes back to 1976, but the pre-1981 data is misleading because all the contract authority was enacted pre-1976 and doesn’t show up. That money was all spent out by 1981 which is when the appropriators had to fully step up.) We then converted those nominal dollars to 2017 dollars using the same deflator used by CBO in their earlier study.
While that earlier data was outlays (cash out the door), this chart shows budget authority (the spending permission granted by Congress in the annual appropriations bills and multi-year authorization acts).
![]()
In fiscal 1981, Congress appropriated the equivalent of $16.2 billion in 2017 dollars for mass transit, an amount that was only topped by the 9/11, ARRA, and Sandy emergency years. That dropped in 1982 when Reagan came in, but by fiscal 1983 the combined total was back to $13.9 billion in 2017 dollars (supported by Trust Fund contract authority for the first time). After a long slide, the TEA21 funding increases brought the total back to just above $14 billion in 2000, where it remained to 2017.
But one can clearly see that, once the Appropriations Committees no longer had to shoulder the full burden of mass transit spending, they were eager to let the authorizing committees deal with it through the Trust Fund. In 1992, for the first time, the Trust Fund provided more contract authority for transit than the general fund provided discretionary appropriations. (The relationship between House appropriators and House authorizers began to deteriorate in the 1980s and was almost completely adversarial by the late 1990s, which may have disproportionately hurt the transit program.)
This was encouraged by the authorizing committees, who set target levels for appropriations in the 1982, 1987 and 1991 acts that, when combined with Trust Fund contract authority, would give transit 20 to 23 percent of total highway-transit funding. But those authorizations are targets, which the Appropriations Committees often ignore. The 1998 TEA21 law tied the hands of the appropriators, and after that, the transit lobby began arguing for the “traditional” 80-20 split of total highway-transit funding. (But if they had started this argument in the early 1980s, it would have been the “traditional 30 percent.”)
And, in what may be a massive coincidence, there is yet another meaning to “80-20.” For most of this period (aside from the 9/11, ARRA, and Sandy spikes), the overall size of the transit budget stayed roughly the same, but the revenue sources completely flipped:
Total FTA Budget Authority (Millions of FY 2017 Dollars) |
||
| FY 1983 | FY 2000 | FY 2017 |
| $13.9 Billion | $14.4 Billion | $13.9 Billion |
| 17% Trust Fund | 84% Trust Fund | 81% Trust Fund |
| 83% General Fund | 16% General Fund | 19% General Fund |
The Highway Trust Fund, and its stagnant motor fuel tax revenue, have been providing around 80 percent of total mass transit funding for most of the last 20 years (83 percent in 2003, 81 percent in 2015-2017). (Yes, a lot of the post-2008 Trust Fund money was really laundered general fund bailouts, but unfortunately those dollars can’t be tracked throughout the process.)
Looking ahead. We did not try to replicate the CBO study for the years 2018 and 2019 for time reasons, and it should be emphasized that all of these numbers and ratios went completely bonkers starting in 2020 with COVID, because Uncle Sam provided $70 billion in mass transit funding under the auspices of COVID but only $10 billion for highways. (As a result, last year, FTA outlays were greater than FHWA outlays.) The last of that COVID aid (the American Rescue Plan) will be spending out of the Treasury through FY 2029, per OMB projections.
But let’s look at the “A&A table” (formally known as Table 26-1, Federal Budget by Agency and Account, in the Analytical Perspectives volume of the FY 2023 federal budget. It is simple enough to add up the projected outlays from the Federal Highway Administration and the Federal Transit Administration to 2032 (the last year of the projections), after the COVID aid spends out completely in 2029 and after the IIJA funding boost starts to wear off when the advance appropriations expire after 2026. The ratio:
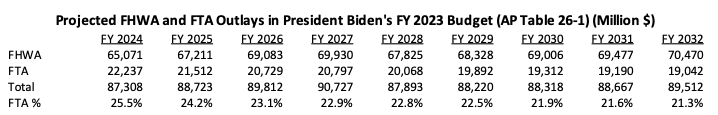
“Same as it ever was.”
-D. Byrne

