October 19, 2018
The nonpartisan Congressional Budget Office has updated its massively useful study of total federal, state and local spending on transportation and water infrastructure since 1956 to cover fiscal years 2015, 2016 and 2017 (the previous report cut off at FY 2014). The study shows that combined state and local spending in these areas peaked in 2015, in real dollars, and actually declined in both years since.
The updated CBO data can be found here and the more detailed 1956-2014 report can be found here.
This series of CBO reports is a treasure trove of information for transportation and infrastructure analysts, for at least eight reasons.
- 1956 to present is a really nice, long timeframe, especially since spending on the Interstate highway system didn’t really start in earnest until FY 1957, so you have a pre-Interstate starting point.
- The report separates its totals into capital spending and operation/maintenance spending.
- The report separates federal grants to state and local governments from direct federal spending.
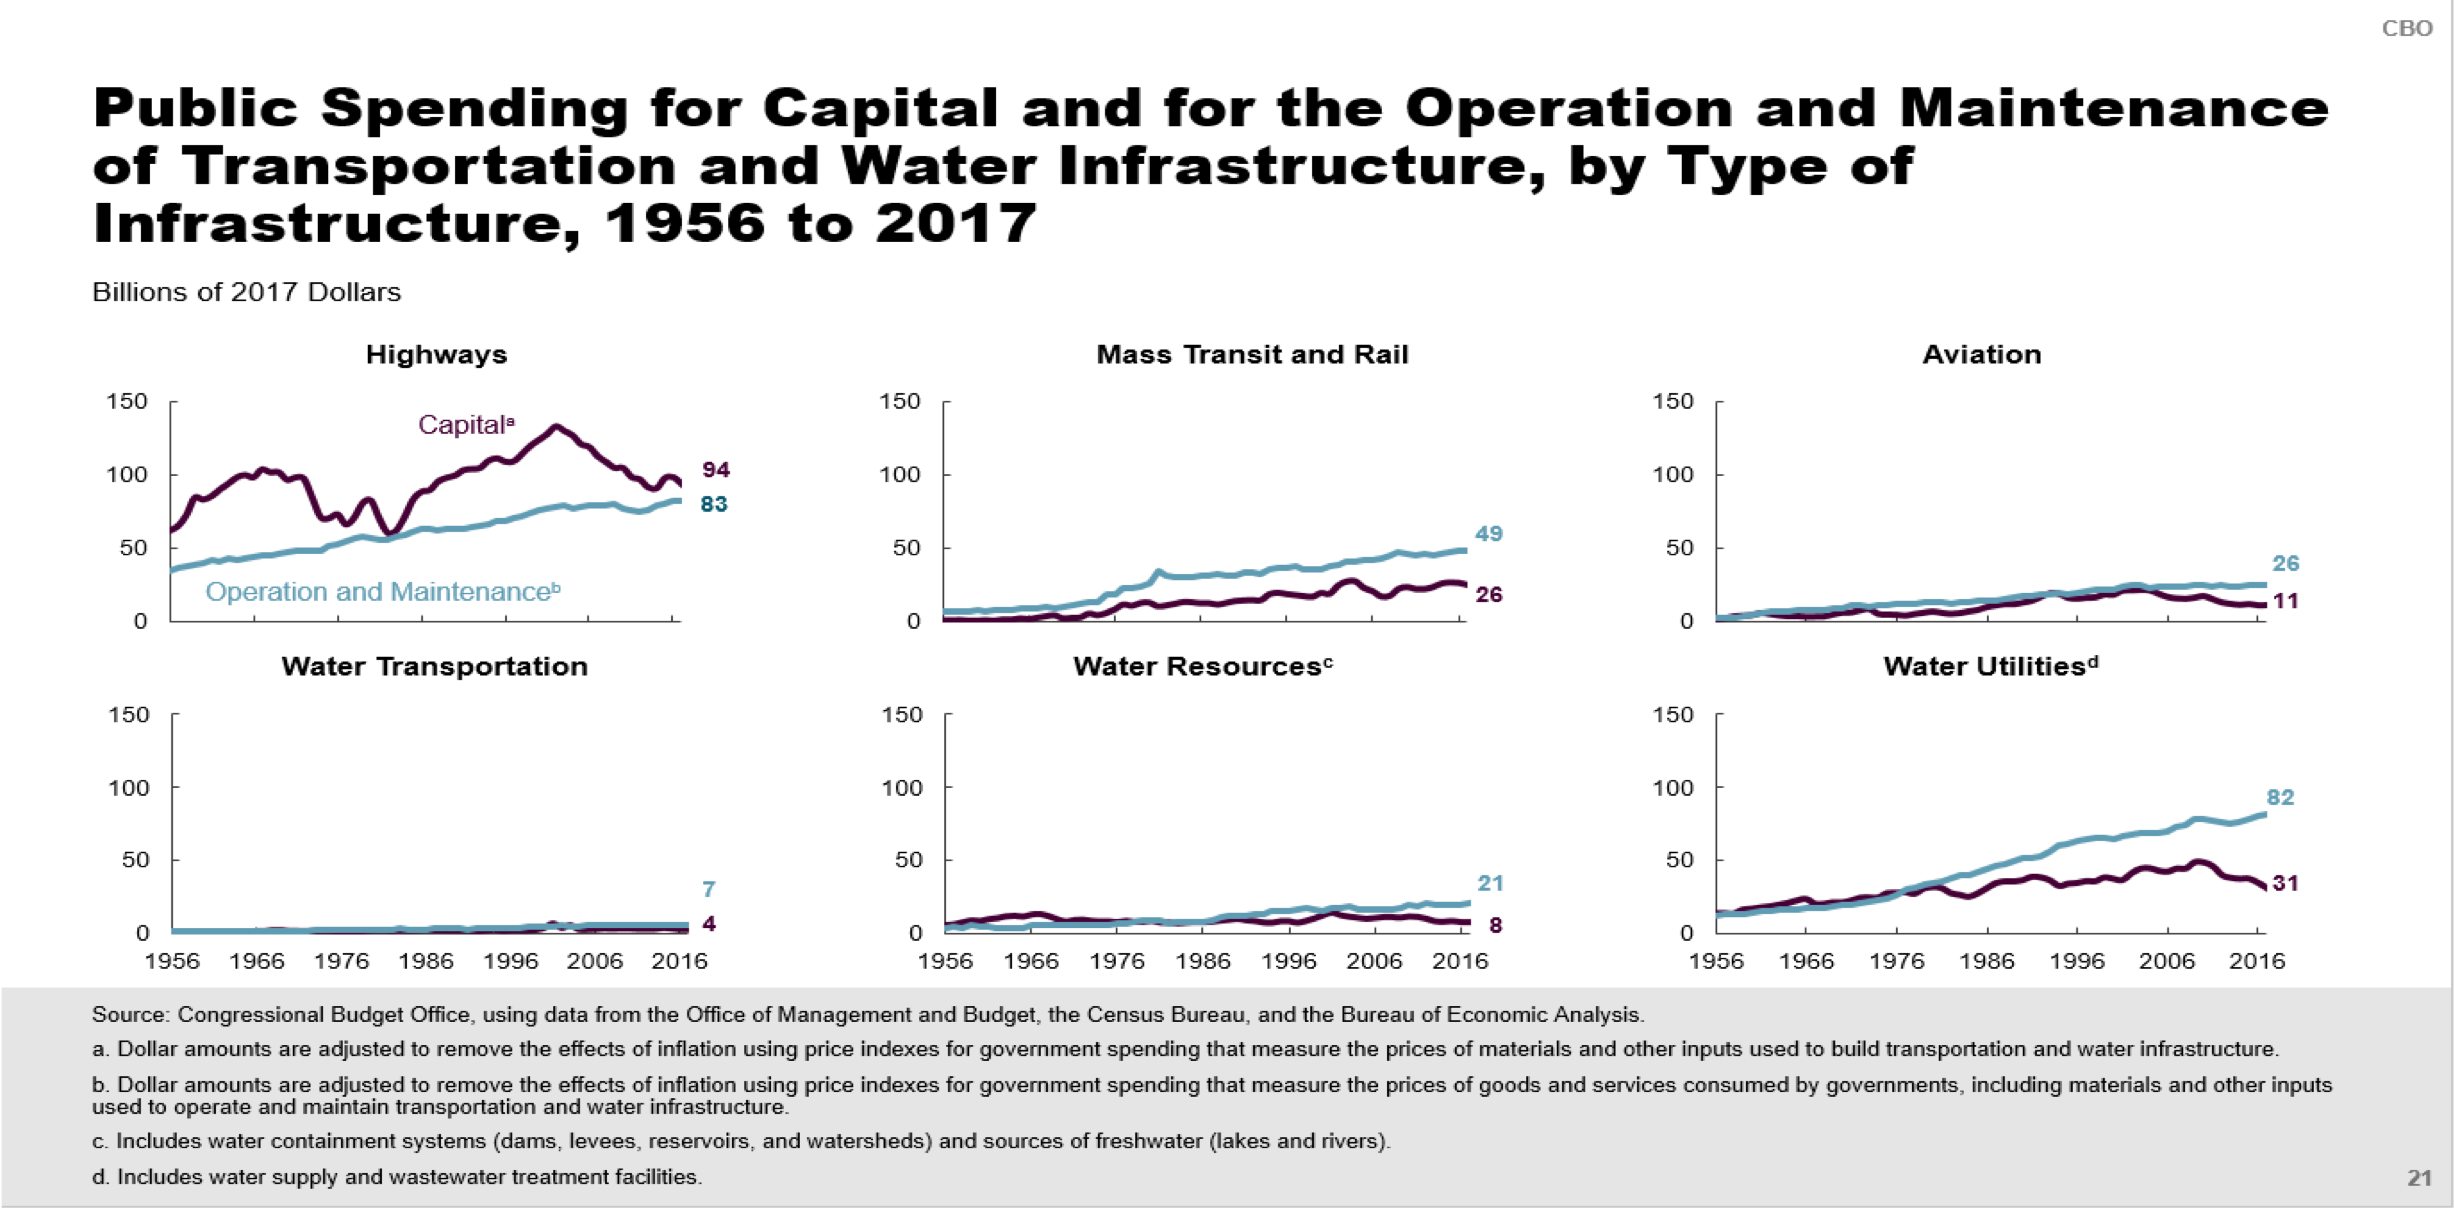
- The report breaks down spending by mode.
- Combined state-local spending data can be hard to find.
- The report converts state fiscal years (July 1 – June 30 in 46 states) to federal fiscal years (October 1 – September 30) which is annoying to do on your own.
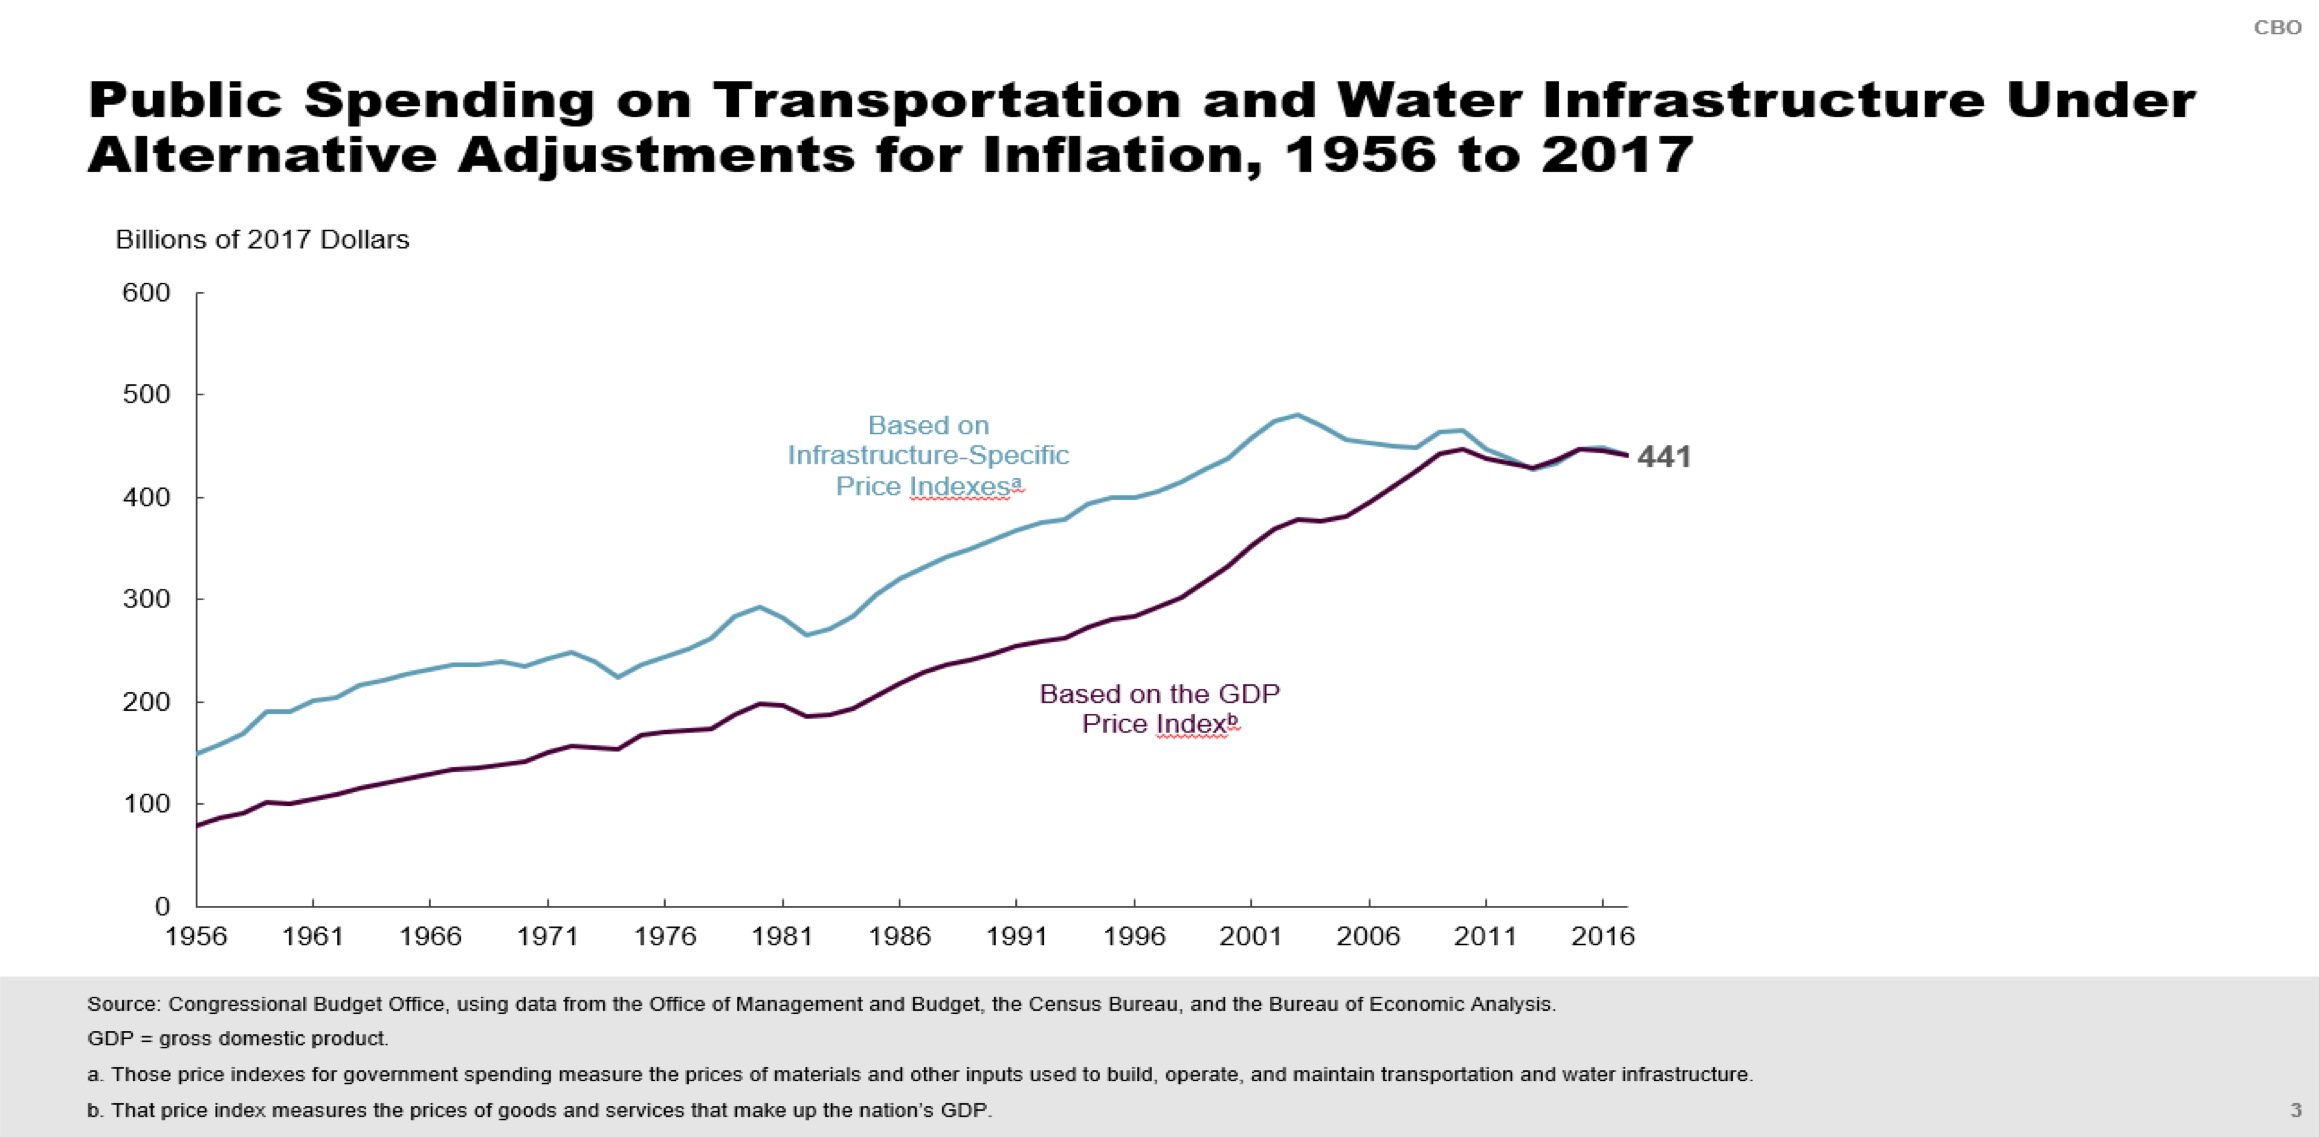
- CBO, like ETW, apparently feels that the standard CPI inflation measure is a bad fit for capital investment programs because CPI is all about price increases in household costs like food, rent, electricity, cable bills, health insurance, health club dues, dog grooming, etc. which don’t bear much resemblance to the cost of gravel, cement, asphalt, structural steel and bulldozer rental. So the CBO report uses alternative measures of inflation that are more suitable to transportation and infrastructure.
- CBO puts its entire dataset on the website in Excel format so data junkies can download, slice and dice to their heart’s content.
All of the spending in the CBO report is in terms of outlays.
As mentioned above, the first thing that jumped out to us was the conclusion that, after peaking in FY 2015, combined state-local spending on transportation and water infrastructure dropped in 2016 and again in 2017 (from $349.6 billion in 2015 to $342.1 billion in 2017), using constant 2017 dollars adjusted for “price indexes for government spending that measure the prices of materials and other inputs used to build, operate, and maintain transportation and water infrastructure.” Total federal spending was $98.4 billion in 2017, versus $98.4 billion in 2015.
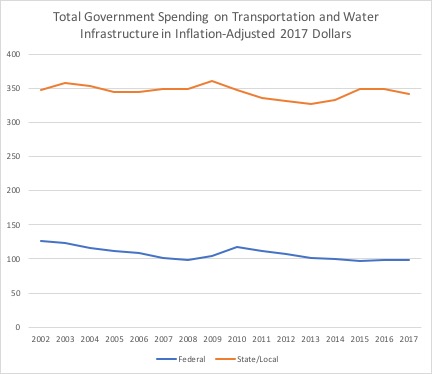
Using this inflation measure, total federal spending peaked 15 years ago, in FY 2002, while combined state-local spending peaked in 2009. The information used to assemble the above graph is shown below for that 15-year period.
| Federal FY |
Total Federal Spending (Billion $) |
Total State/Local Spending (Billion $) |
| 2002 |
126.640 |
347.449 |
| 2003 |
122.700 |
358.070 |
| 2004 |
115.985 |
353.246 |
| 2005 |
111.936 |
344.329 |
| 2006 |
108.469 |
344.983 |
| 2007 |
101.094 |
349.286 |
| 2008 |
99.189 |
349.711 |
| 2009 |
103.639 |
360.777 |
| 2010 |
116.922 |
348.170 |
| 2011 |
111.880 |
335.399 |
| 2012 |
106.812 |
330.894 |
| 2013 |
100.735 |
326.973 |
| 2014 |
99.769 |
333.315 |
| 2015 |
97.428 |
349.636 |
| 2016 |
98.959 |
349.350 |
| 2017 |
98.393 |
342.110 |
However, using this same measure of inflation, it is clear that government, on the whole, is spending a whole lot more these days than it spent each year in the 1950s, 1960s, 1970s, 1980s, or 1990s, so people shouldn’t necessarily get nostalgic for the transportation and spending policies of those decades. (Using a different non-CPI measure, total spending peaked in 2010.)
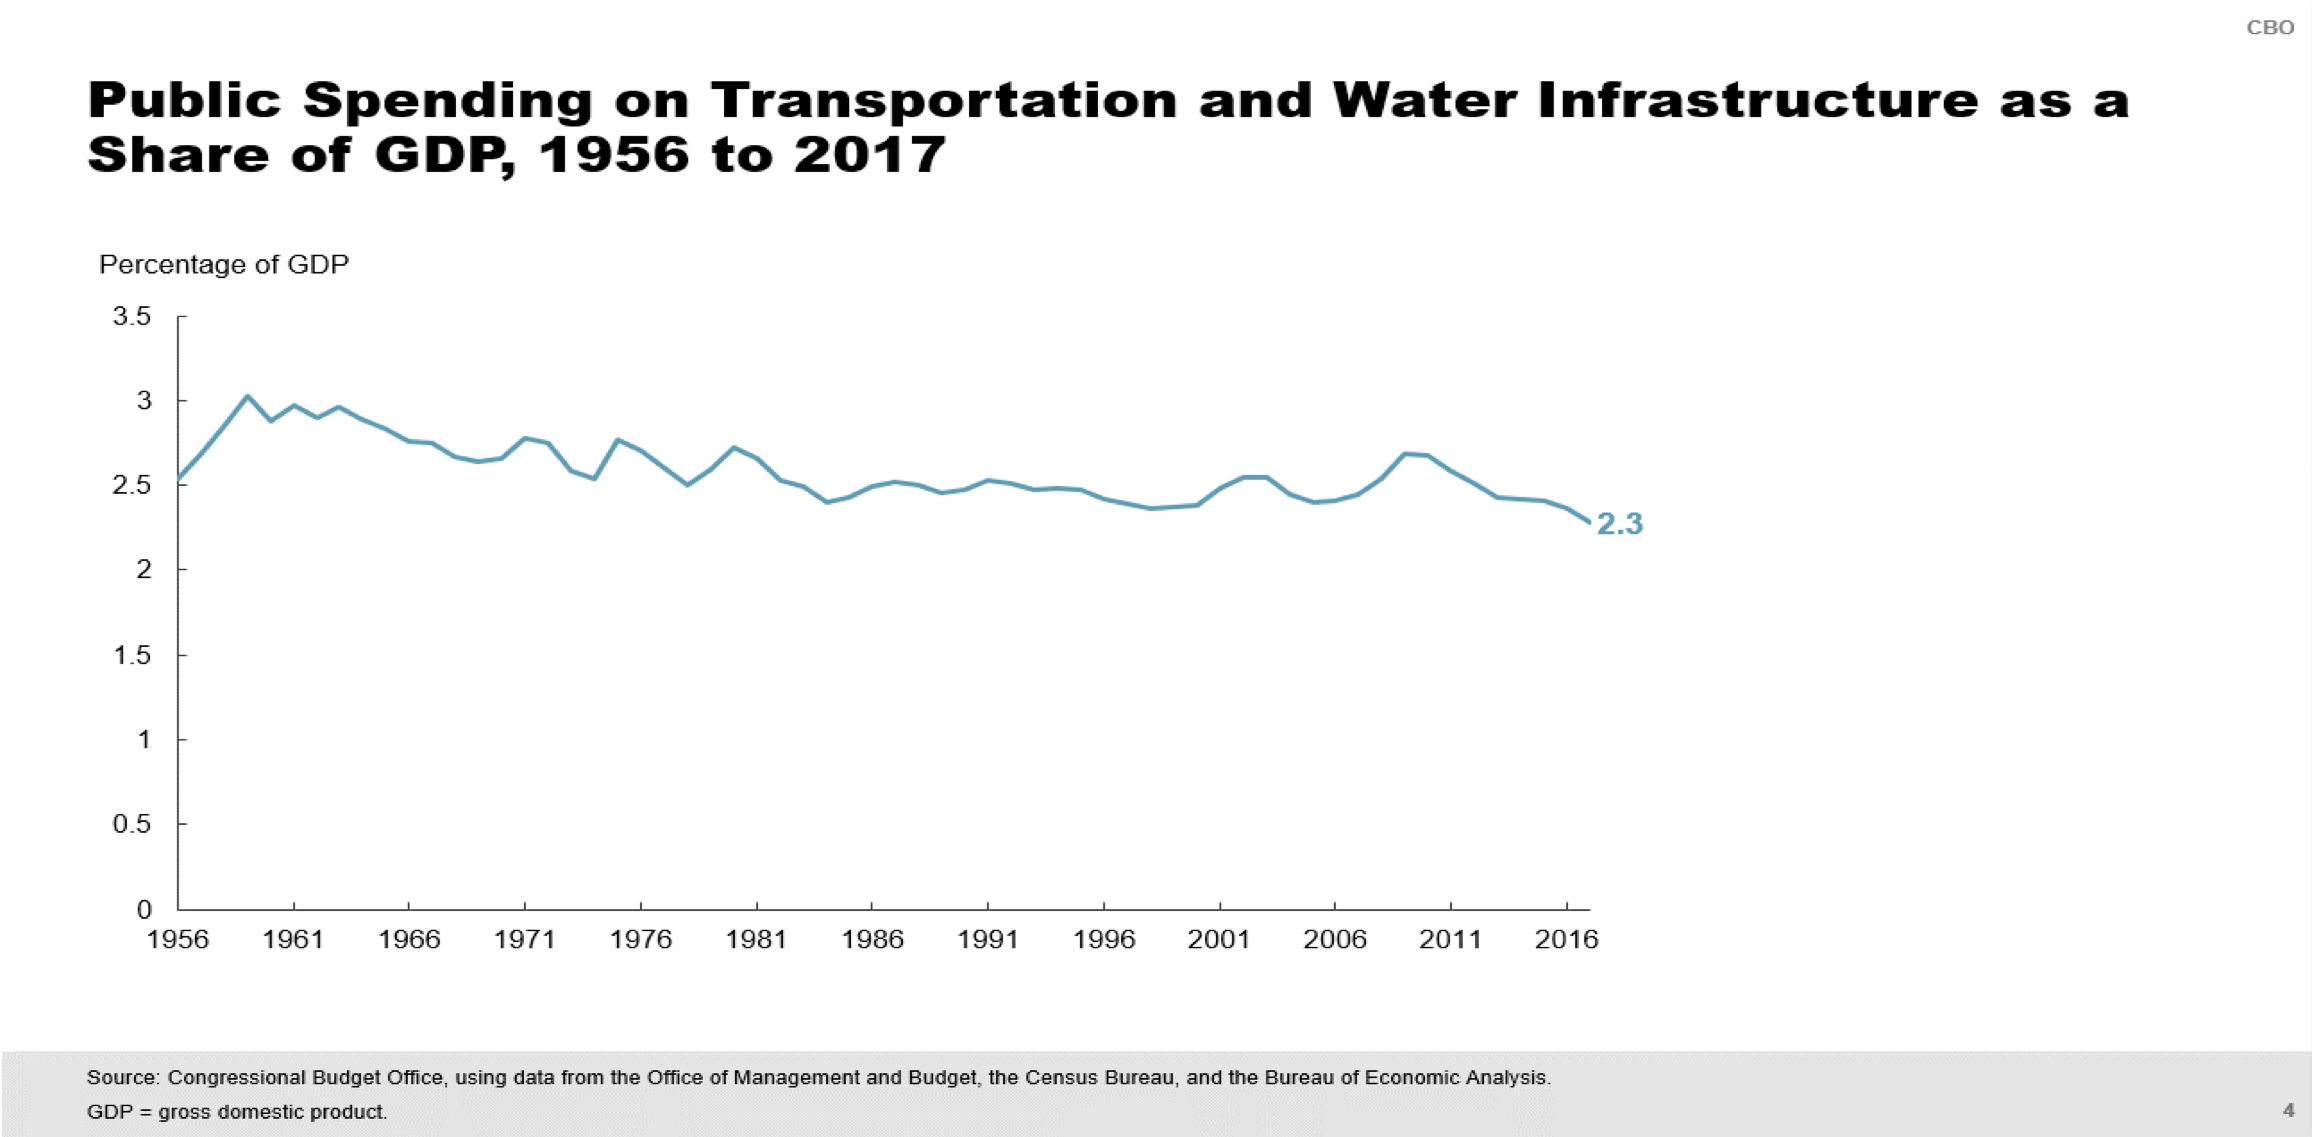
Measured as a share of the entire economy, total federal-state-local spending on these programs actually peaked in 1959, at 3.03 percent. FY 2017’s 2.28 percent was the lowest of any year covered in the report (the CBO chart is below, but in this instance we think the y-axis should be stretched out).
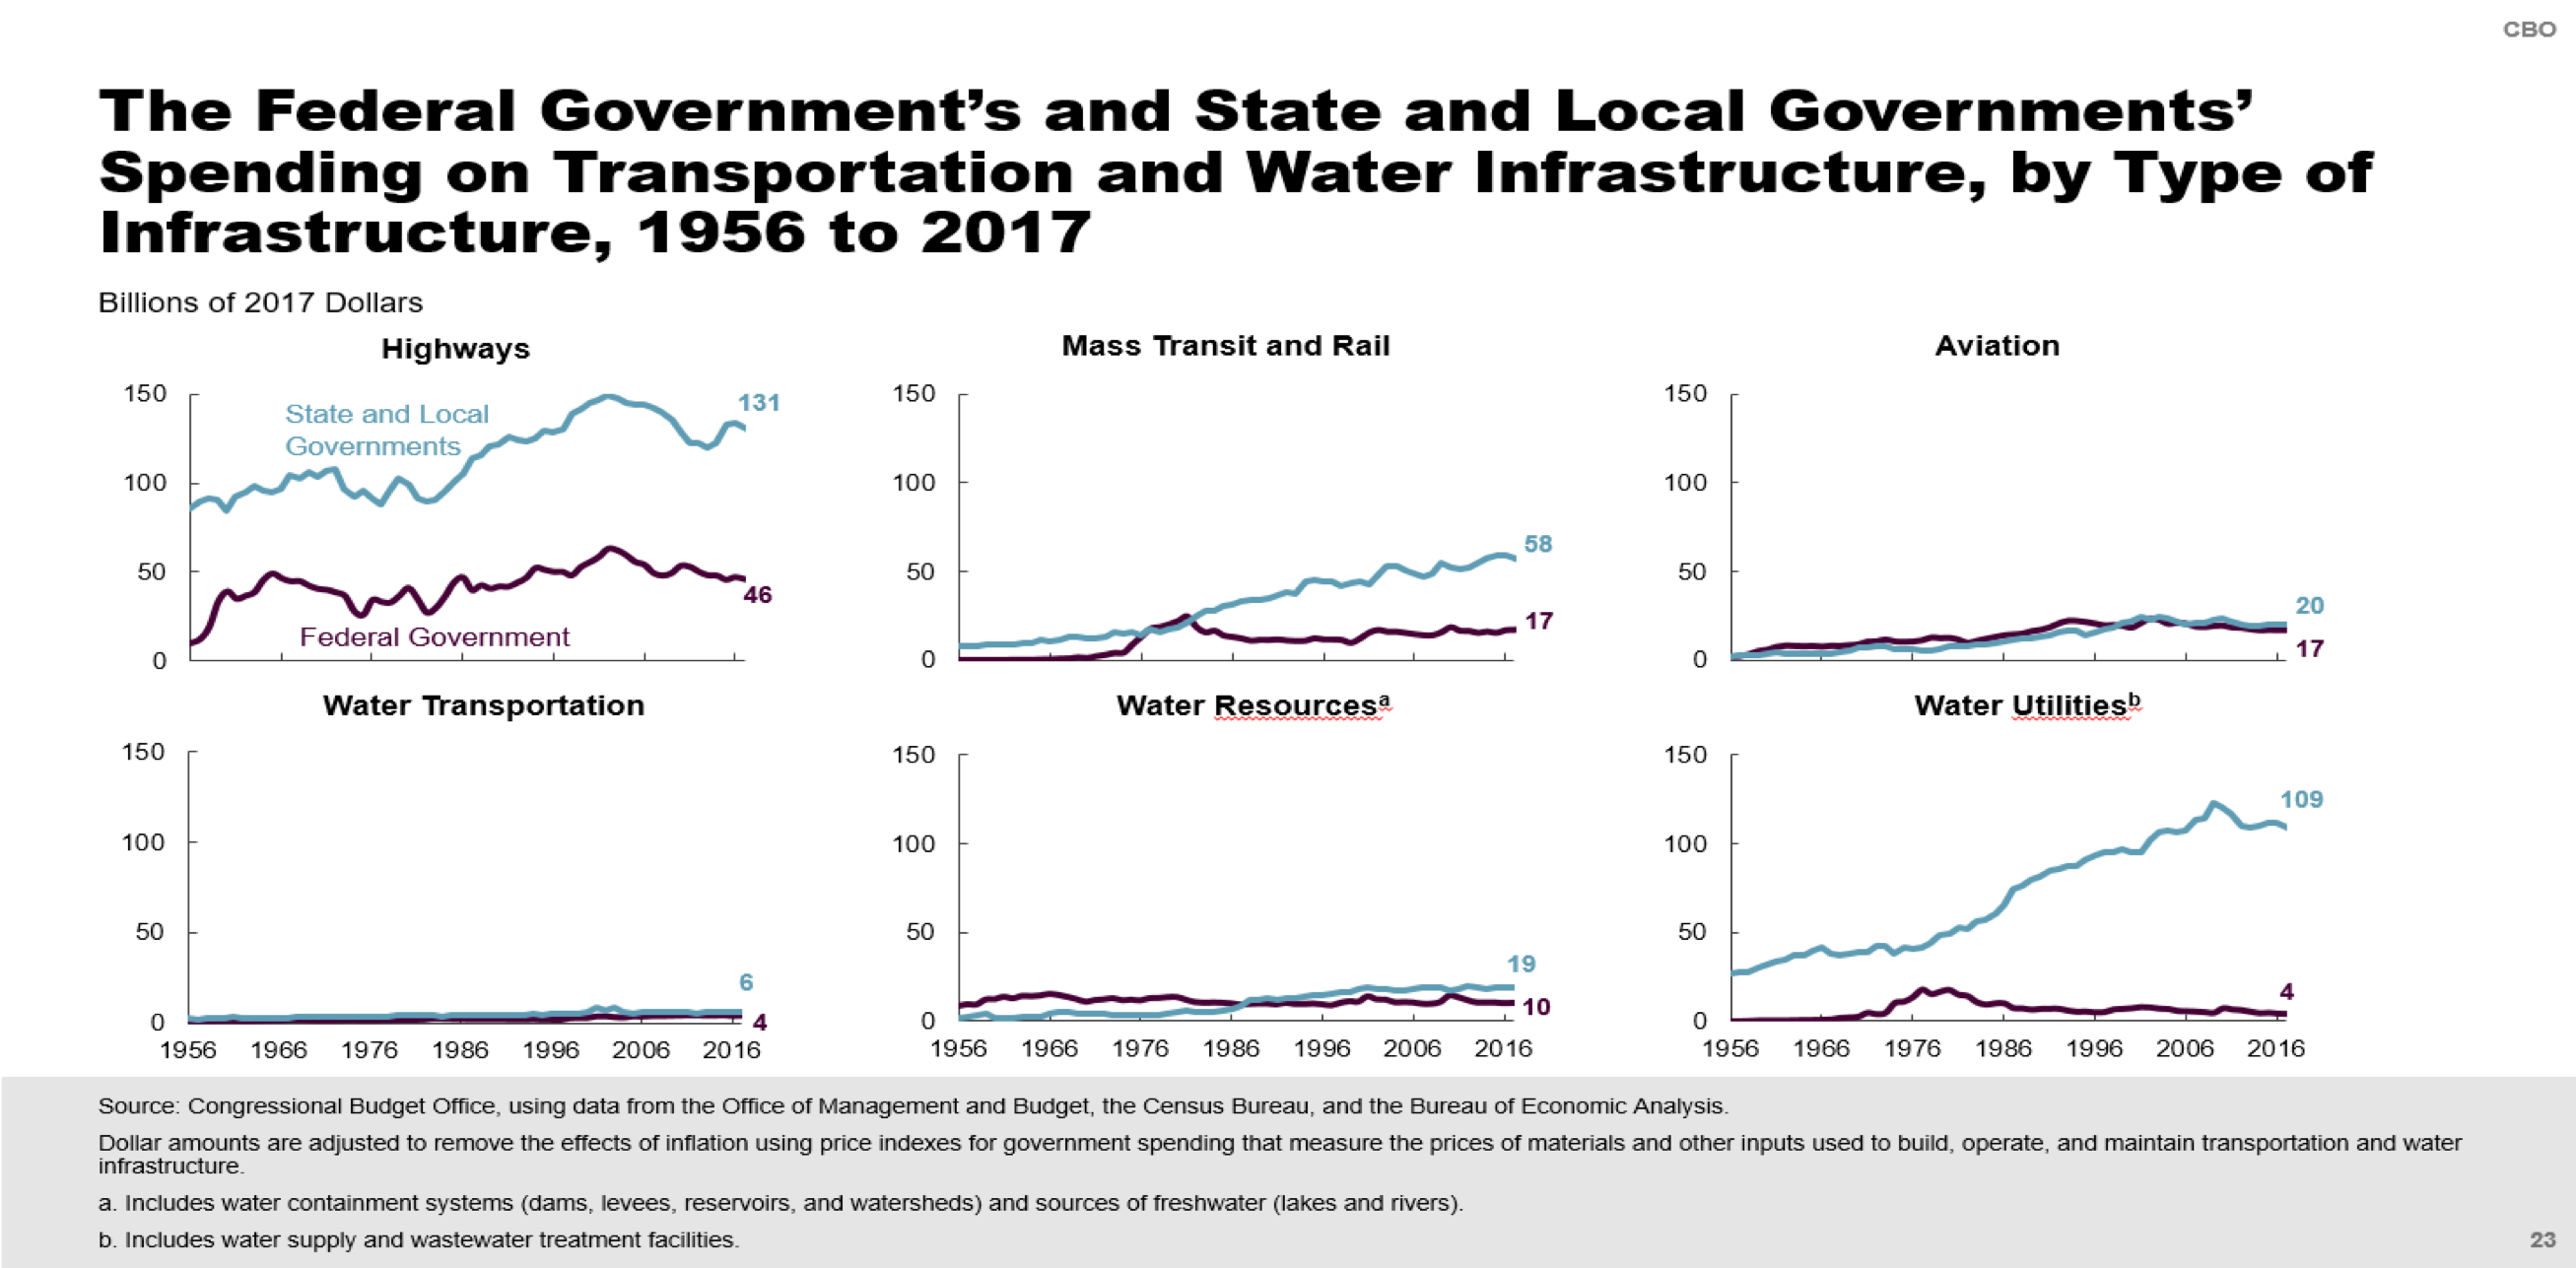
Total spending by all levels of government totaled $440.5 billion in 2017, and the report breaks this down by mode:
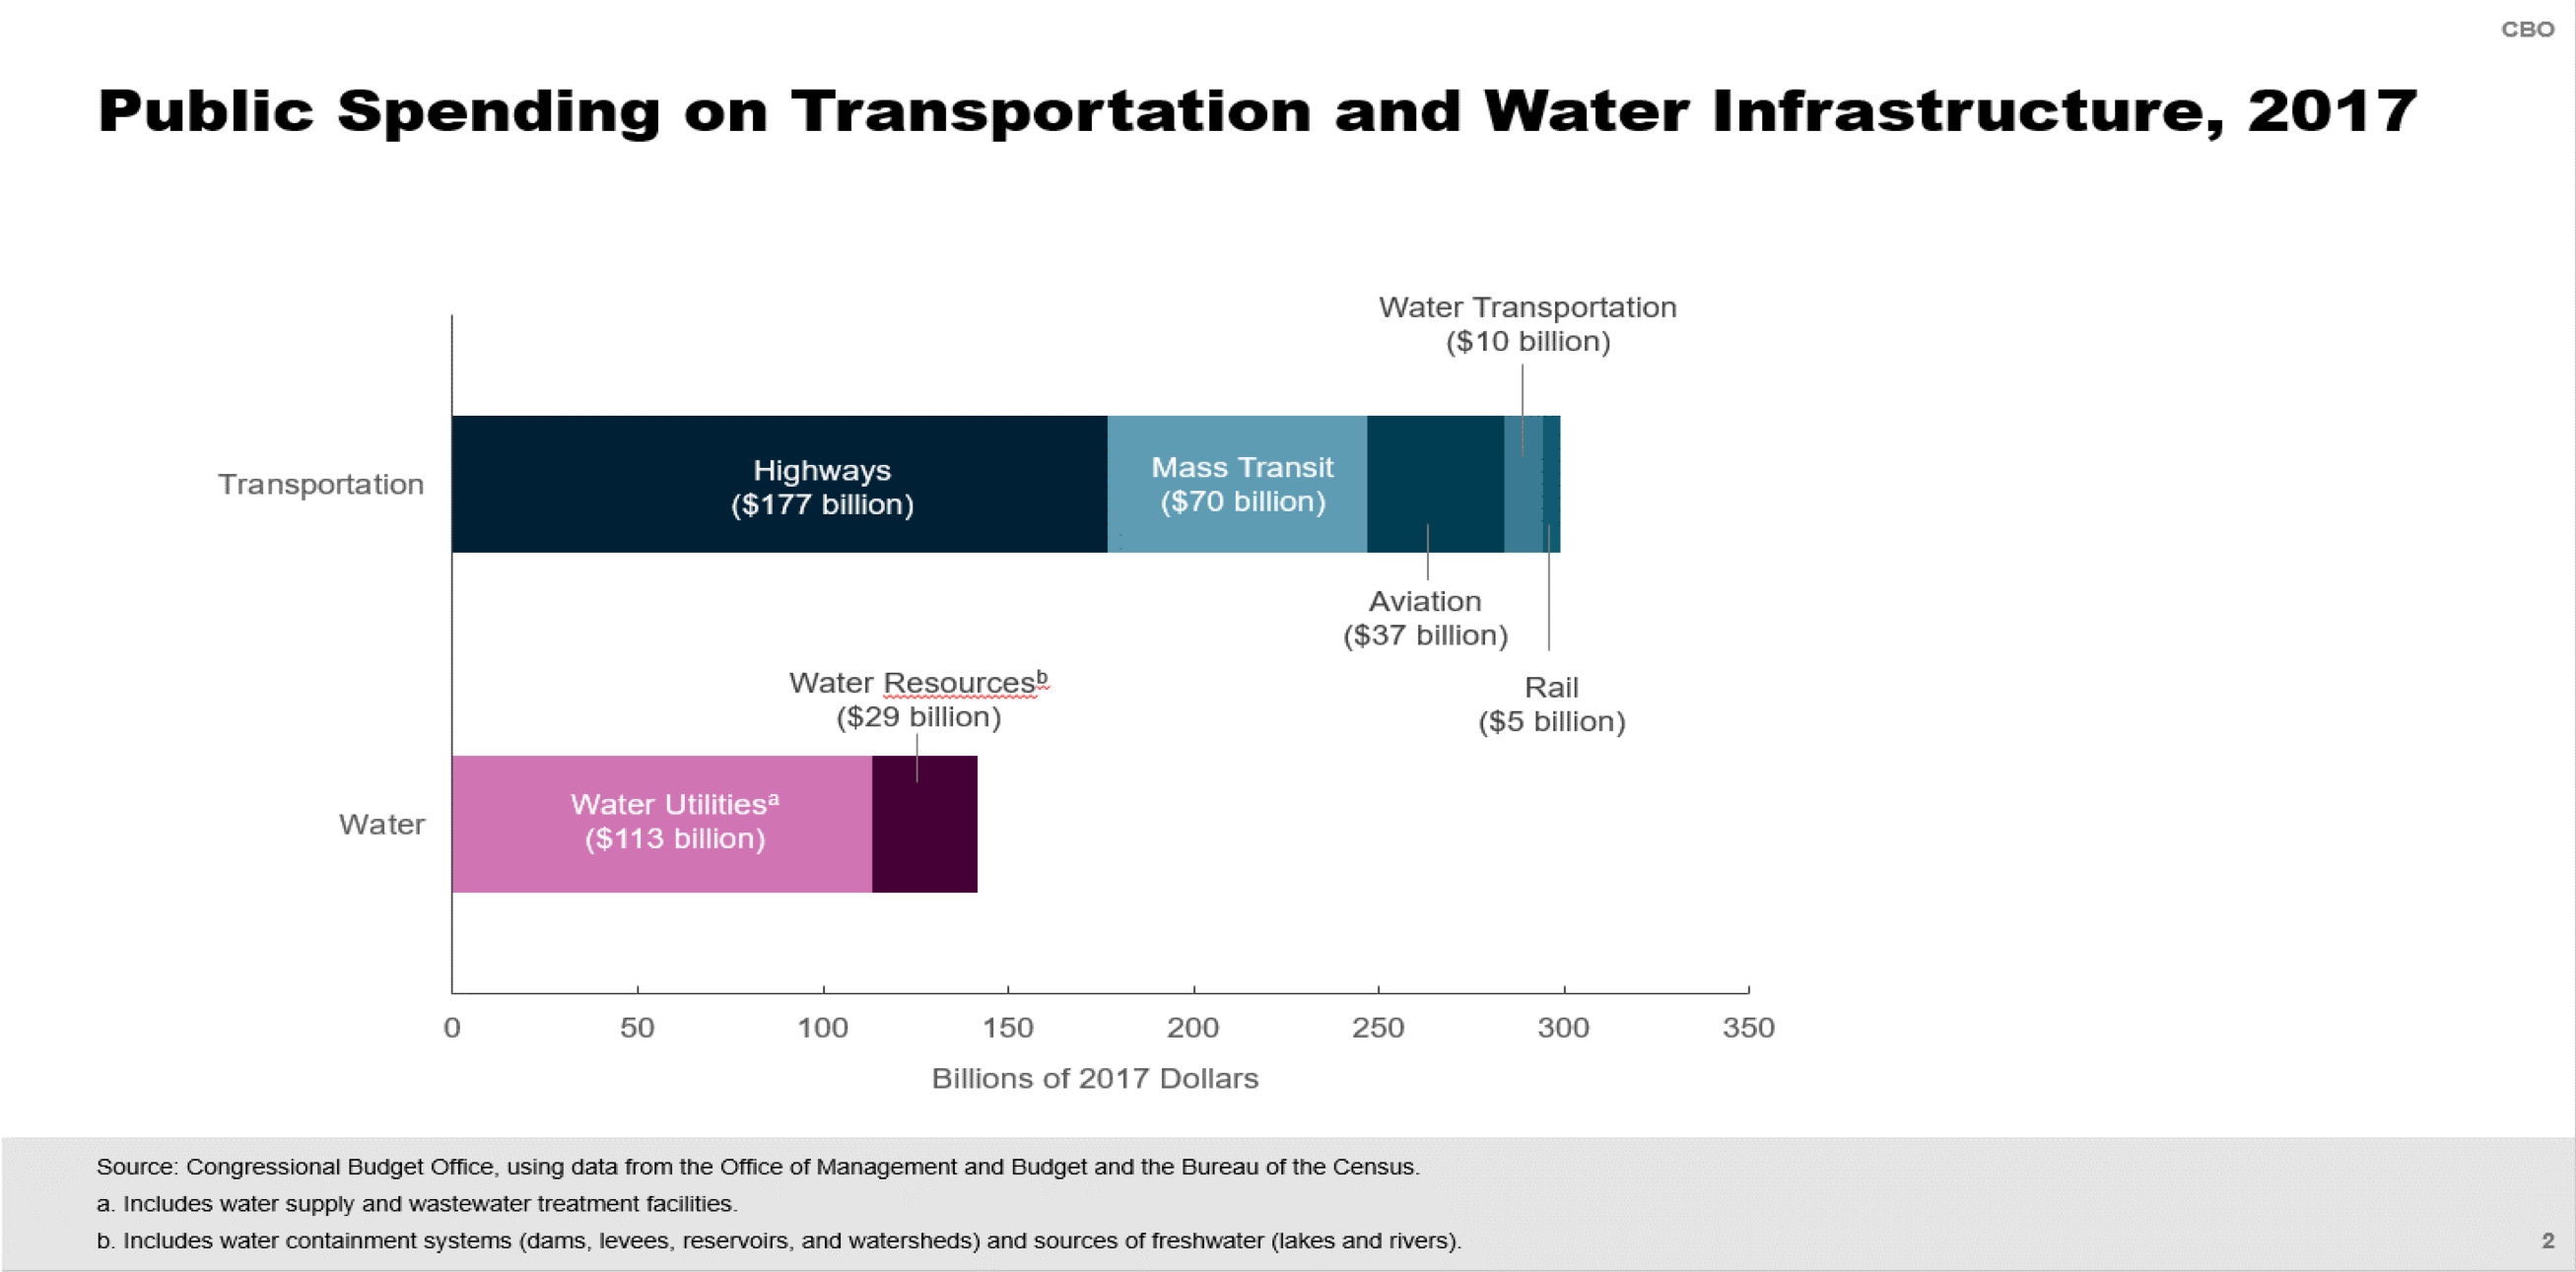
(CBO breaks down water three ways. Water transportation—waterways, ports, and the equipment used to support sea-borne traffic (such as Coast Guard vessels). Water resources—water containment systems (dams, levees, reservoirs, and watersheds) and sources of freshwater (lakes and rivers). Water utilities—supply systems for distributing potable water as well as wastewater and sewage treatment systems and plants.)
And speaking of water, this next chart is really striking – it shows how that the bulk of the 1956-2009 growth in total spending by state and local governments was water utilities, with an honorable mention to mass transit and rail.
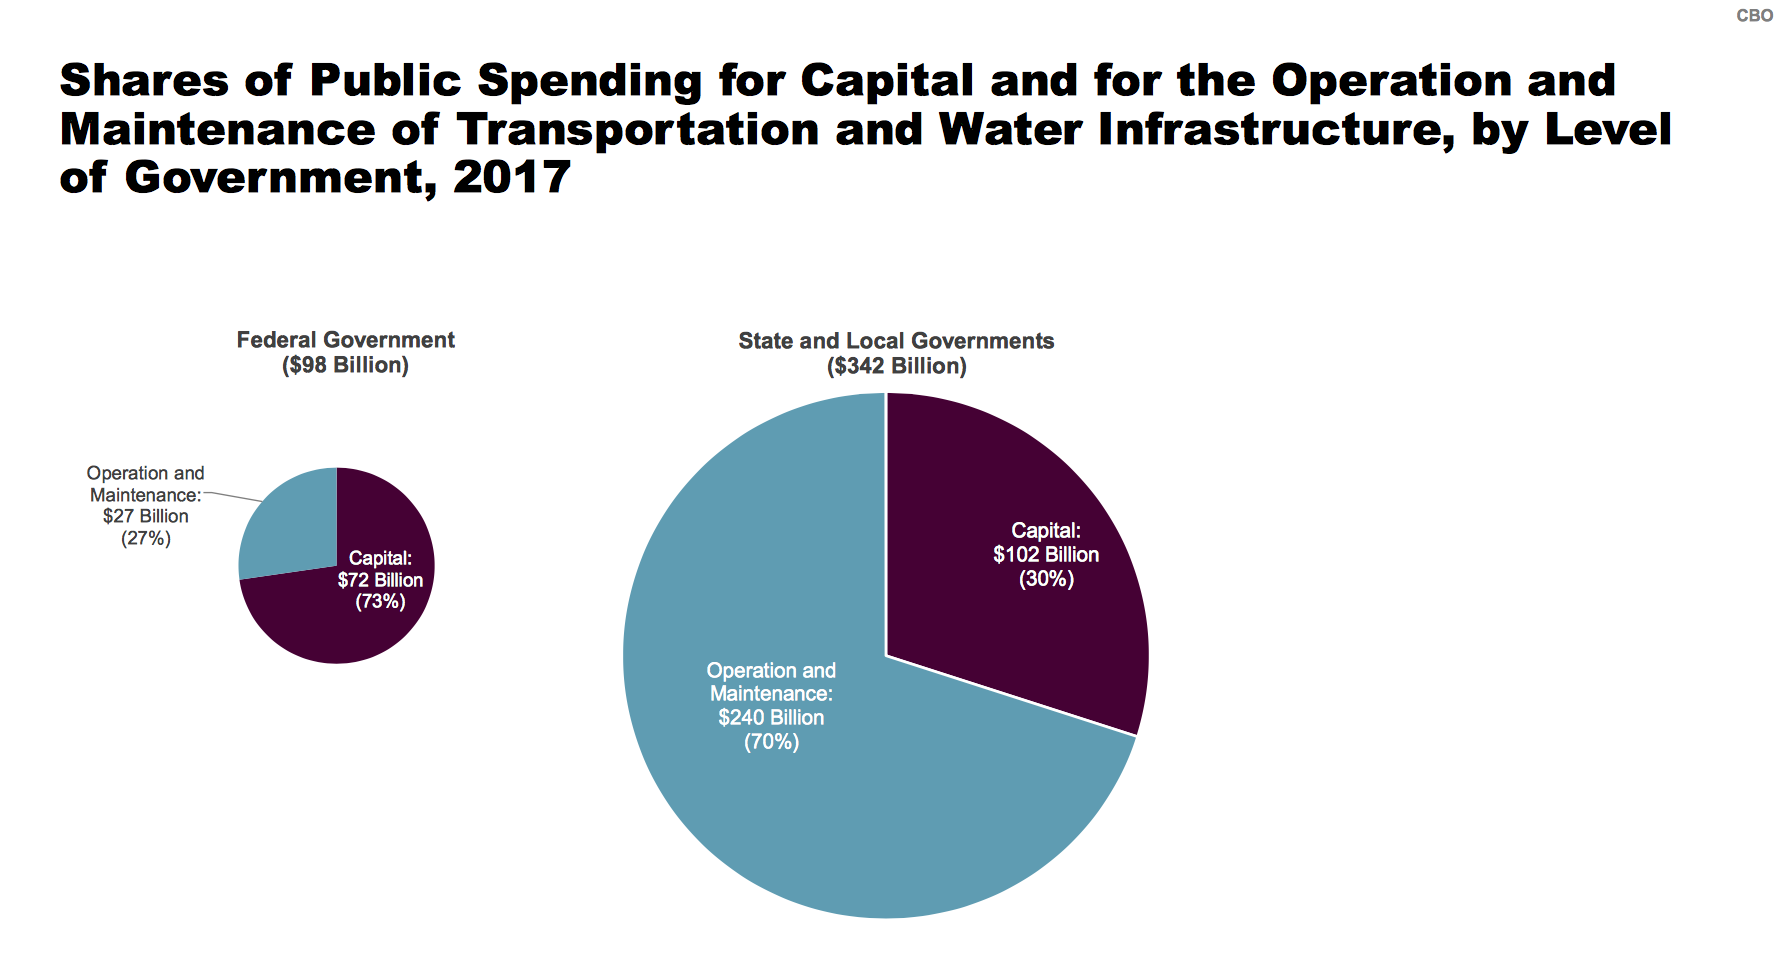
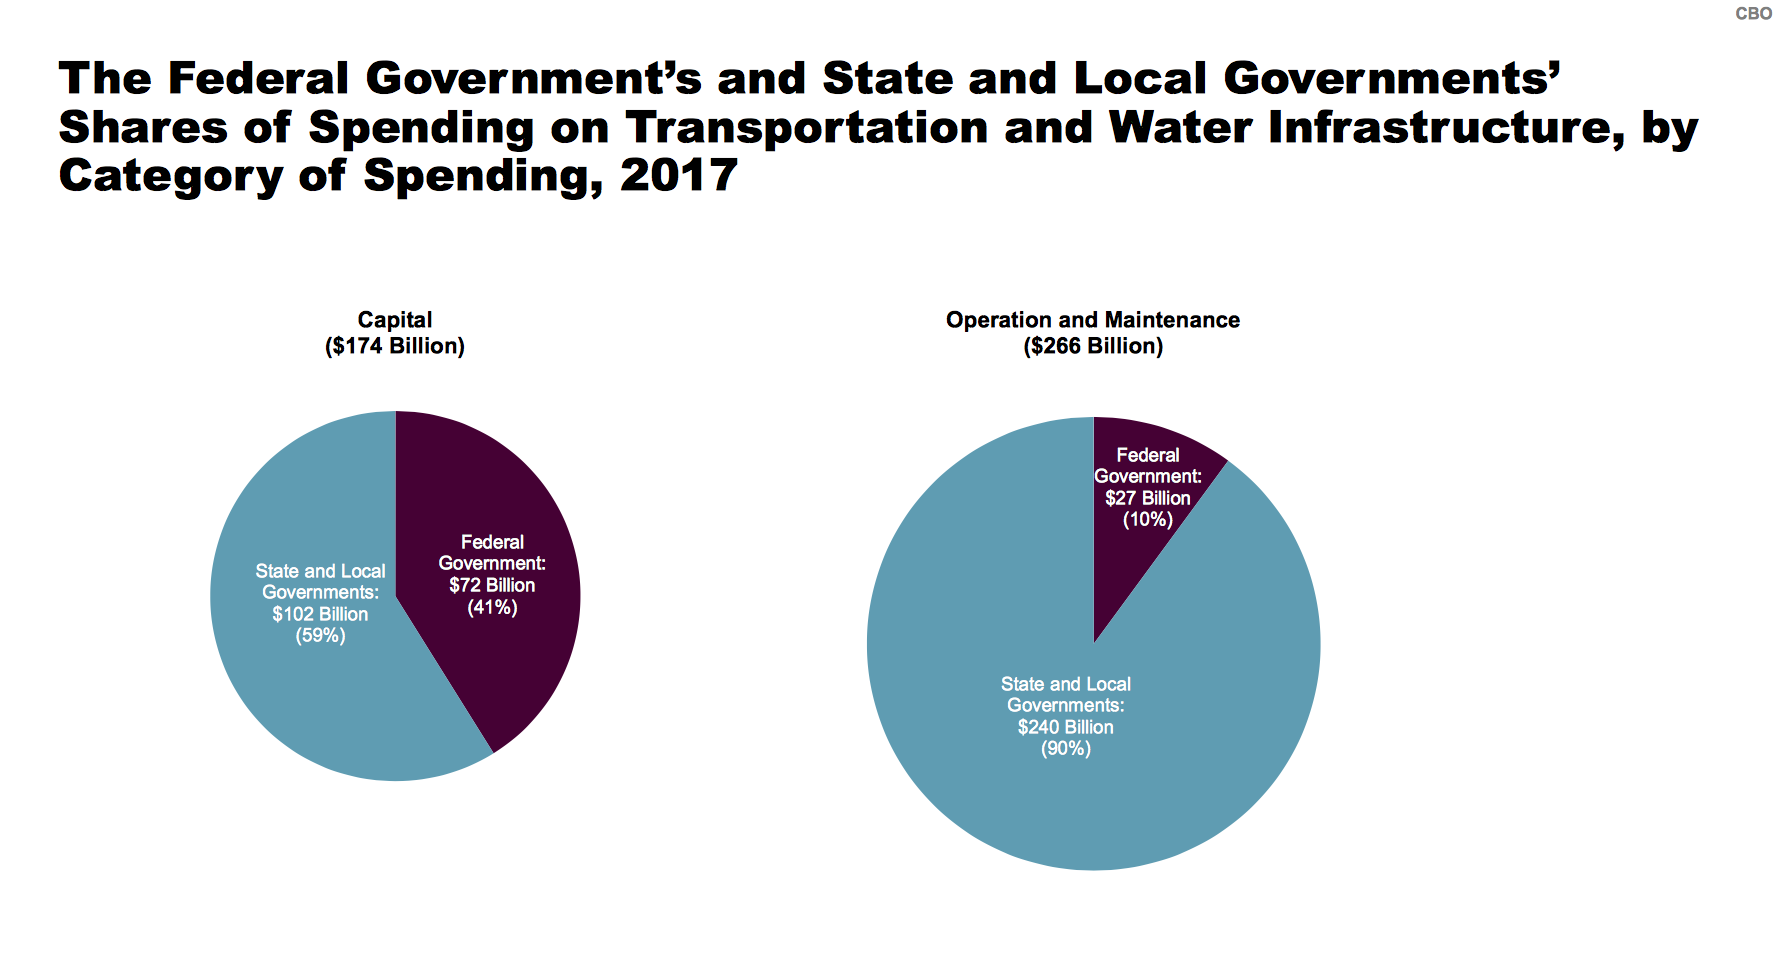
The report also makes clear the differing federal and state roles in providing capital expenses versus taking care of operations and maintenance. Here are two inverted displays of the same four numbers for FY 2017 – federal capital ($72B), federal O&M ($27B), state/local capital ($102B), and state/local O&M ($240B) – the first shows the total federal and state/local spending levels split up into capital and O&M, and the second shows total capital and O&M split up into state/local and federal.
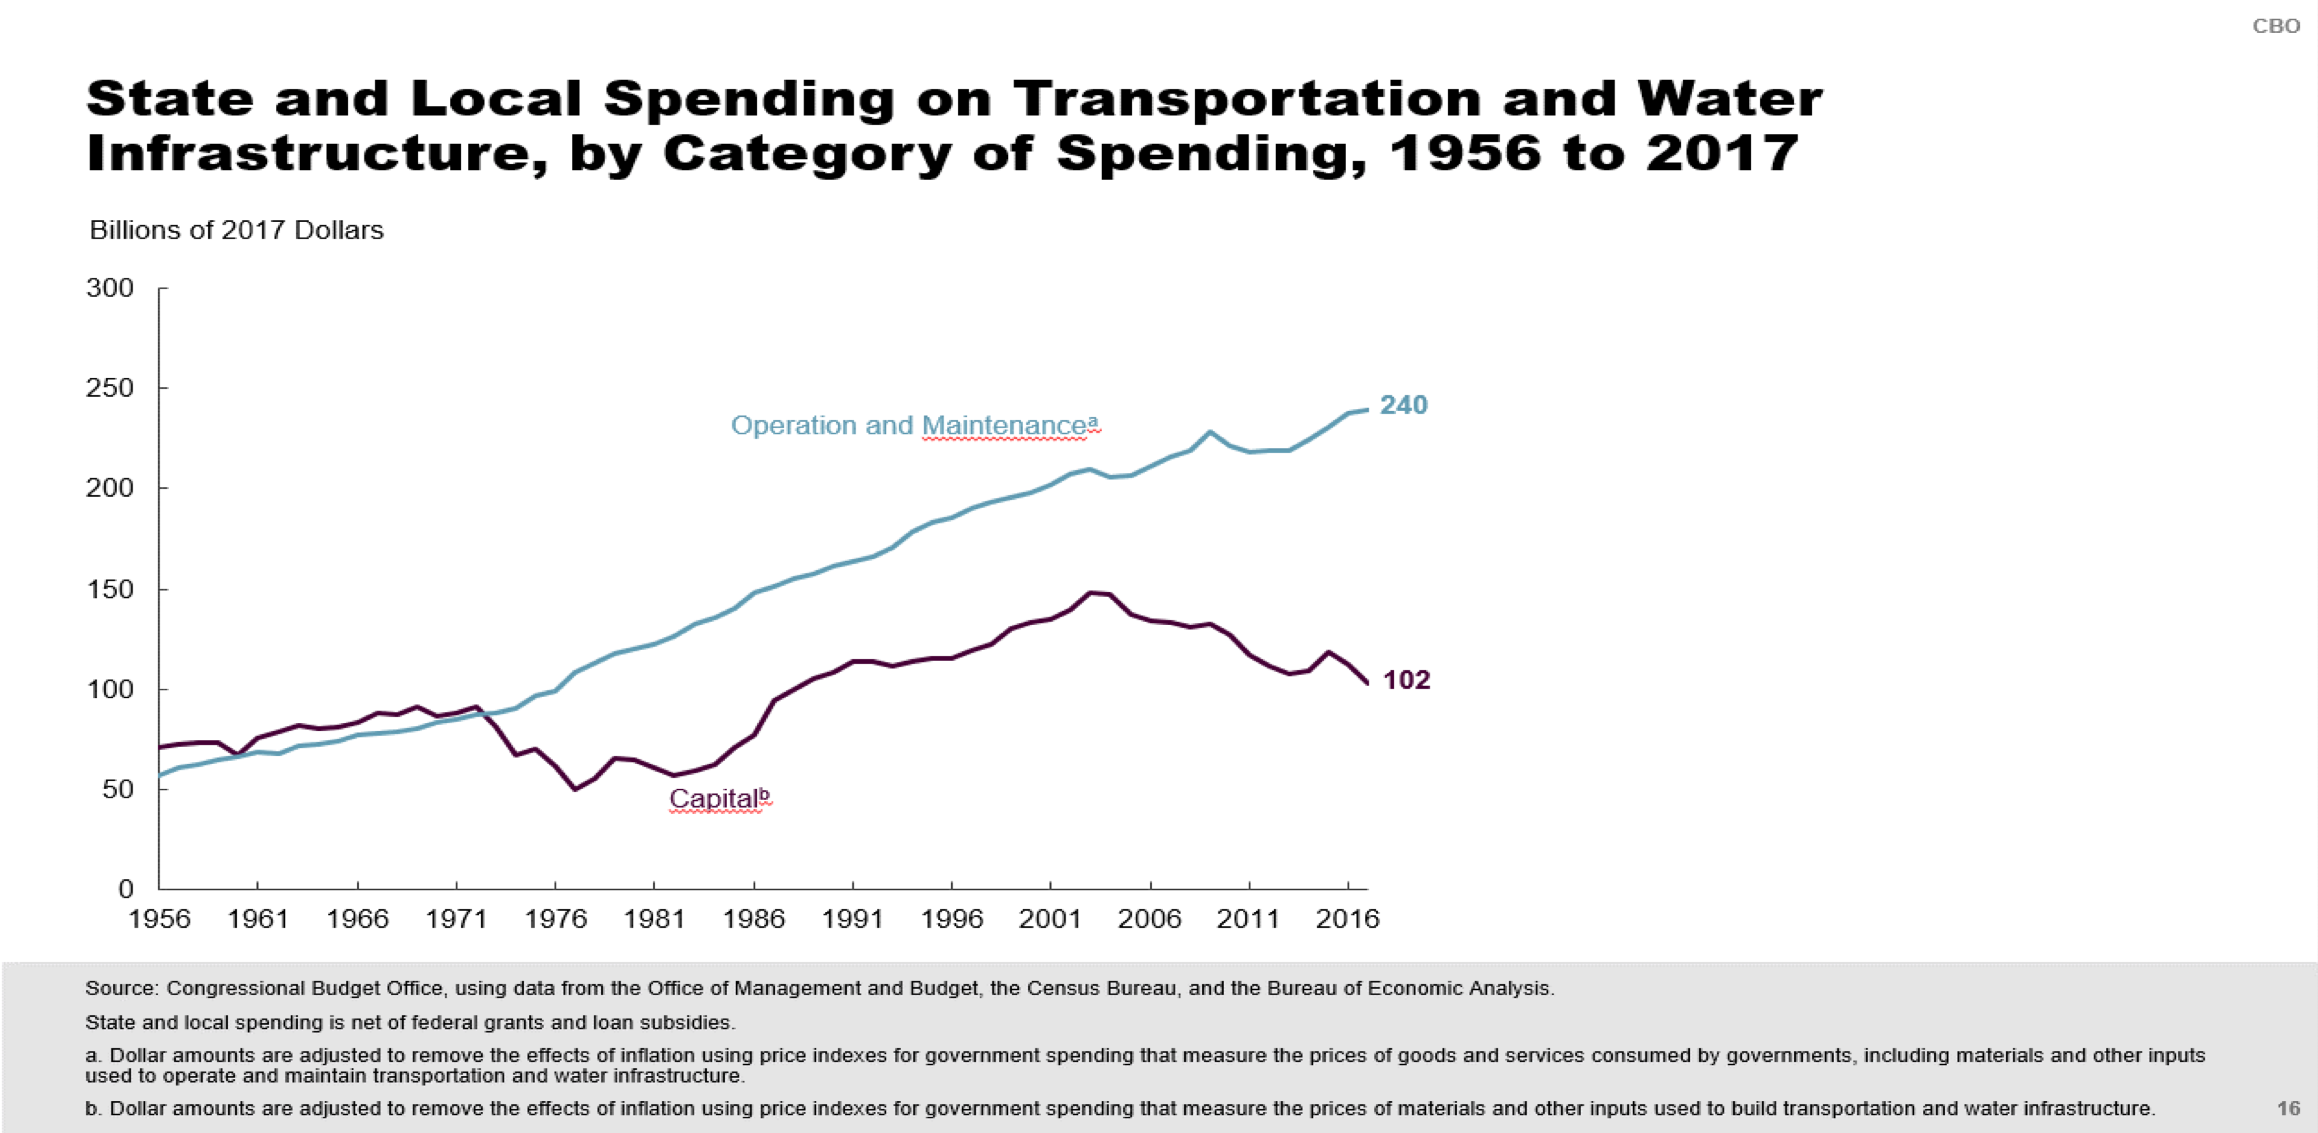
Over the 1956-2017 period, in constant dollars, it is clear that capital spending is the second priority behind O&M. Total capital spending declined precipitously in the 1970s as Interstate construction slowed down, and then grew again from a lower base at a fairly consistent rate until peaking in 2002. The slope of the O&M increases over the years, however, is remarkably constant.
And the report then breaks down that above chart by mode.
Once again, all that data can be downloaded here.

