The nonpartisan Congressional Budget Office has released a helpful research overview entitled Emissions of Carbon Dioxide in the Transportation Sector.
CBO reports often provide a one-stop-shop for the latest forecasts on a subject. In this instance, the biggest forward-looking question is: how quickly will electric vehicles displace internal combustion engine (ICE) vehicles as a percentage of new sales, and as a percentage of the on-road fleet?
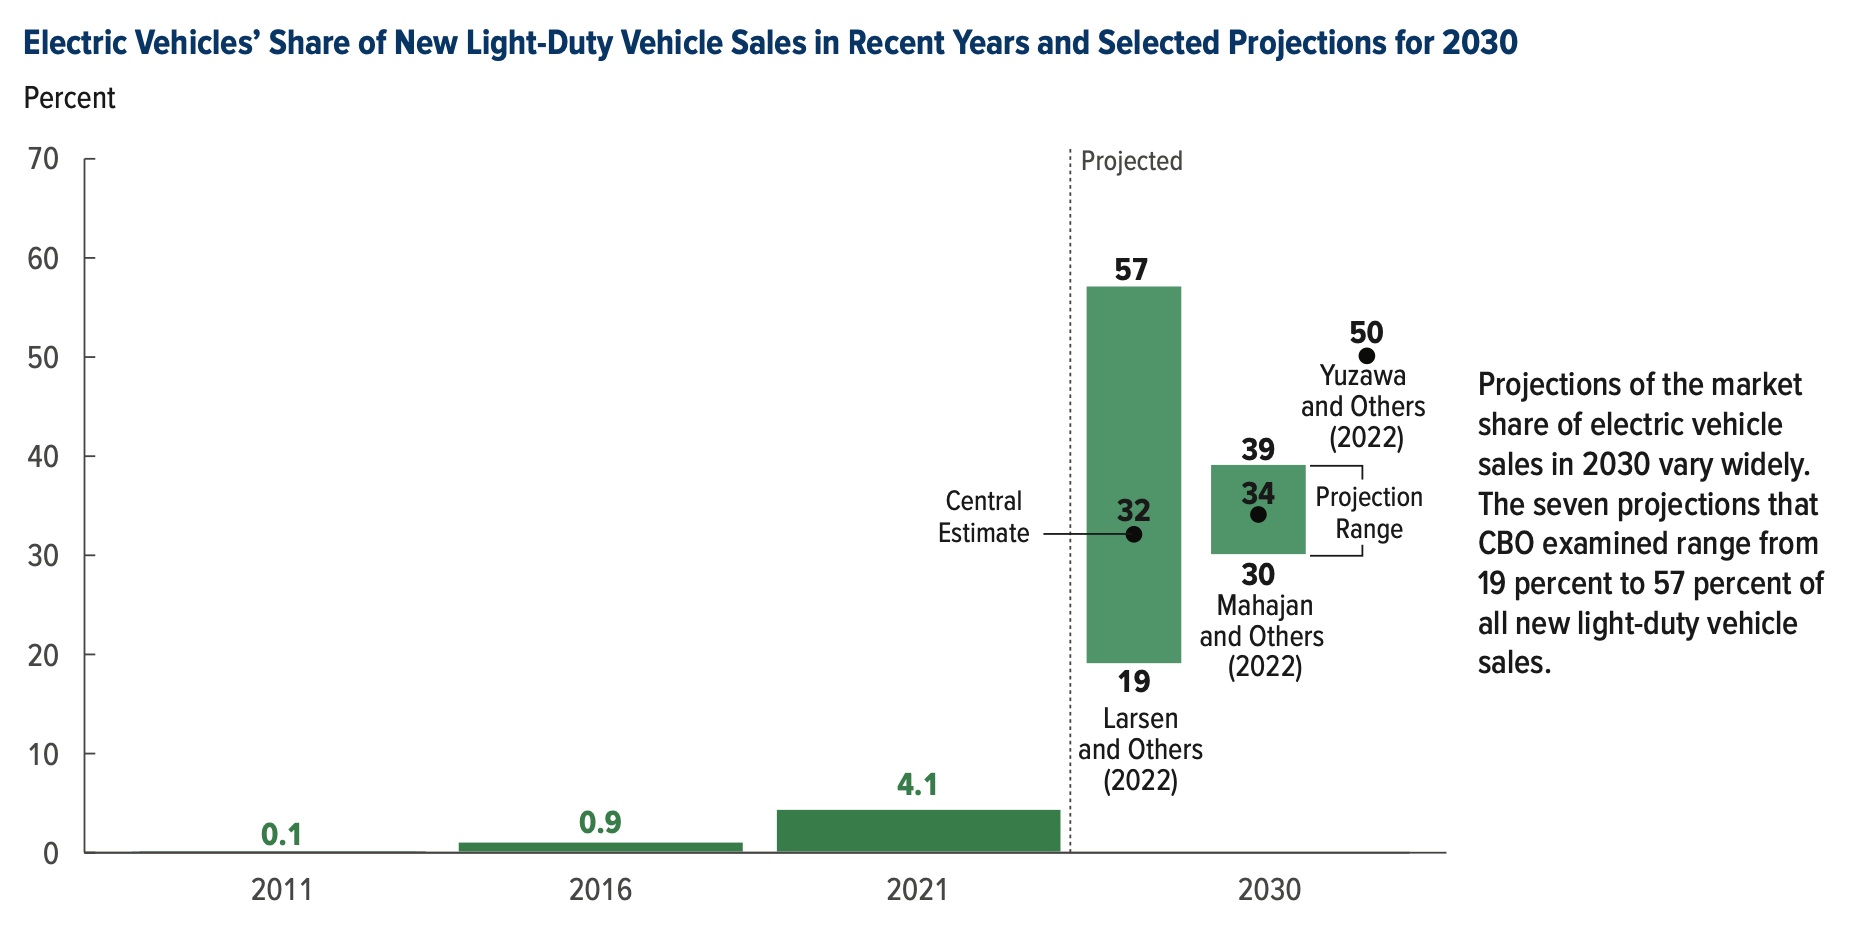
In this case, CBO cites three different projections issued in the last twelve months, two of which have high-middle-low ranges, and found the midrange estimates for new EV sales in 2030 are around one-third of new light-duty vehicles sold (versus 4.1 percent of those vehicles sold in 2021).
The CBO report also points out that operating an EV doesn’t magically remove CO2 emissions from the act of moving the vehicle; it simply moves the emissions upstream, from the tailpipe of the vehicle itself to the exhaust flue of the power plant generating the electricity that charged the EV’s battery. This varies by region, depending on the blend of carbon-emitting (coal, natural gas, petroleum) to non-carbon-emitting (hydro, nuclear, solar, wind, biomass) electrical generation sources, and it varies widely.
(Probably not coincidentally, CBO also released a report on CO2 generation from electrical plants this week that explored this.)
For example, CBO’s analysis shows that the most carbon-emitting electrical generation is in, not surprisingly, coal-loving Wyoming, at almost one ton of CO2 (1,976 pounds) emitted per megawatt-hour of power generated. On the low end, Vermont is an outlier (only 23 pounds per MWh) which gets Canadian hydropower and burns a lot of wood, but a more typical low-end state is Idaho, blessed with a lot of natural hyrdopower drop and wind, at 213 pounds of CO2 per MWh.
(Interestingly, the fourth highest-emitting state power sector is Hawaii. Think about it. No nuclear, no real space for hydro, and no native fossil fuels, so no low-emission natural gas. Everything has to come by ship, so they have just burned fuel oil for most of the last century, though wind and solar are now building out. They are still at three-quarters of a ton (1,515 pounds) of CO2 per MWh.)
So, if you live in Wyoming and fully charge the 131 kilowatt-hour extended battery in your F-150 Lightning, you are releasing 259 pounds of CO2 into the atmosphere. But if you charge the same F-150 Lightning in neighboring Idaho, with a very different electric power source blend, you would only be releasing 28 pounds of CO2 into the atmosphere.
Ford claims that the 131 kWh battery will get you 300 miles on the road. (Probably not in a Wyoming winter at altitude, as Sen. Lummis has pointed out.) But taking Ford at their word, in Wyoming, 259 pounds of CO2 per full charge is about 0.86 of a pound of CO2 emitted per vehicle-mile. Across the border in Idaho, 28 pounds of CO2 per full charge is only 0.09 of a pound per vehicle-mile.
Then you make whatever assumptions you are making about how many people are in the truck, and compare your electric F-150 operating CO2 emissions to other types of vehicle:
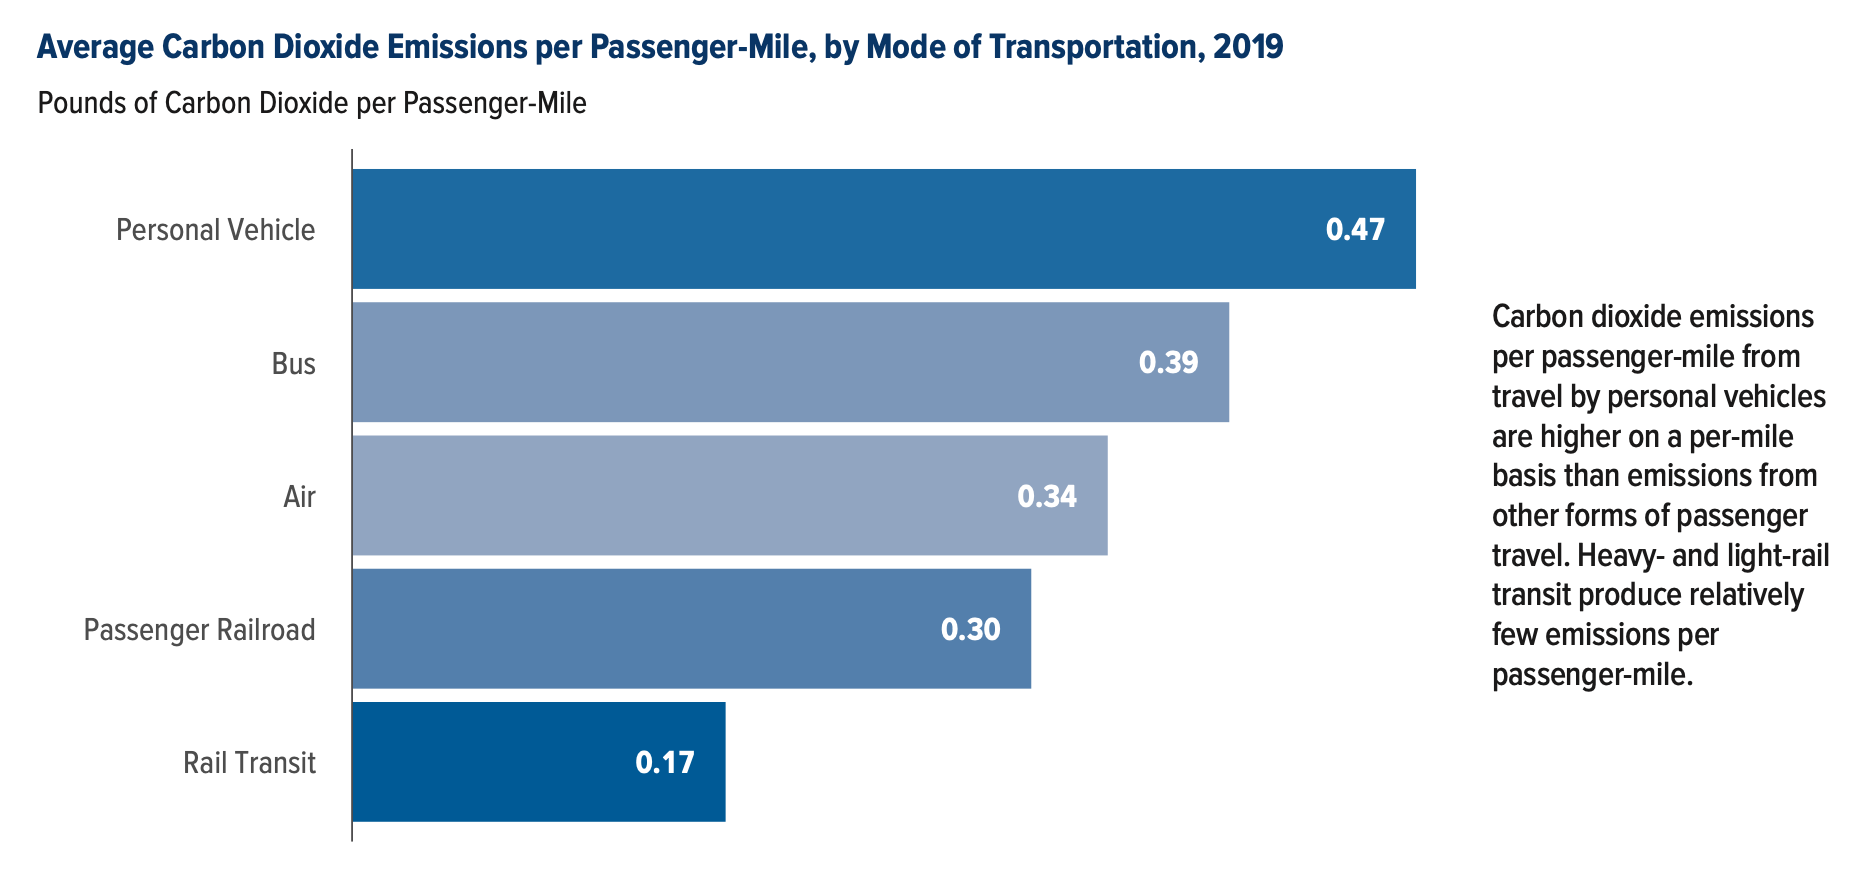
Operating a single-occupant electric F-150 in a coal-intensive area like Wyoming actually releases almost twice as much CO2 into the atmosphere as does operating a the national average regular (ICE) personal vehicle on a per-passenger-mile basis (0.86 vs 0.47). (Per the EPA, burning one gallon of gas in an ICE releases 8,887 grams of CO2 into the atmosphere, which is 19.59 pounds, so at 20 miles per gallon, an ICE vehicle emits 0.98 pounds of CO2 per mile. In other words, operating that electric F-150 in Wyoming releases the exact same amount of CO2 into the atmosphere as operating an ICE vehicle that gets 22.5 mpg.)
This regional variance in the CO2 emissions from electricity generation also affects the relative carbon release from other types of electric transportation, like rail mass transit. One of the great things about CBO reports these days is that they also let you download an Excel spreadsheet with all of the data used to generate the splashy graphics in the report (this one is here).
For Figure 7 in the report, CBO analyzed some statistics from the 14 heavy rail systems in the U.S. – passenger-miles and average load factor (both from 2019, so the data is pre-COVID), and the relative carbon content of the electricity as discussed above, and used that to produce a measure of CO2 released per passenger-mile for the various systems:
| Heavy Rail System |
Pounds of CO2 per pax-mile |
| San Francisco BART |
0.094 |
| New York City Subway |
0.108 |
| New Jersey PATH |
0.147 |
| Atlanta MARTA |
0.173 |
| Boston “T” |
0.176 |
| Los Angeles Metro |
0.205 |
| Philadelphia SEPTA |
0.228 |
| Washington Metro |
0.295 |
| New Jersey PATCO |
0.299 |
| Chicago “L” |
0.320 |
| Staten Island Railway |
0.389 |
| Miami-Dade Transit |
0.469 |
| Cleveland Rapid |
0.525 |
| Baltimore Metro |
0.985 |
At the bottom end of the scale, Baltimore’s rail system suffers not because its electric utility is heavy into coal (it isn’t) but because in 2019, its trains only averaged 8.5 percent full. For the Chicago L, the trains averaged 45.4 percent full, but the local electric utility generates 985 pounds of CO2 per megawatt-hour.
As shown in the bar chart above, the average for rail transit is 0.17 pounds of CO2 released per passenger-mile, mostly because the NYC subway, at a 59 percent load factor and buying power from providers that average 635 pounds of CO2 per MWh, comes in at just 0.108 pounds per passenger-mile, and NYC has such a huge share of the national passenger-miles (10.5 billion pax-miles in 2019, with the other 13 heavy rail systems only adding up to 6.9 billion pax-miles).
CBO did the same kind of modal GHG analysis for freight, using the freight ton-mile data from BTS and the GHG emissions (in CO2 equivalent) from this massive April 2022 EPA report (Table A-101 in Annex 3):
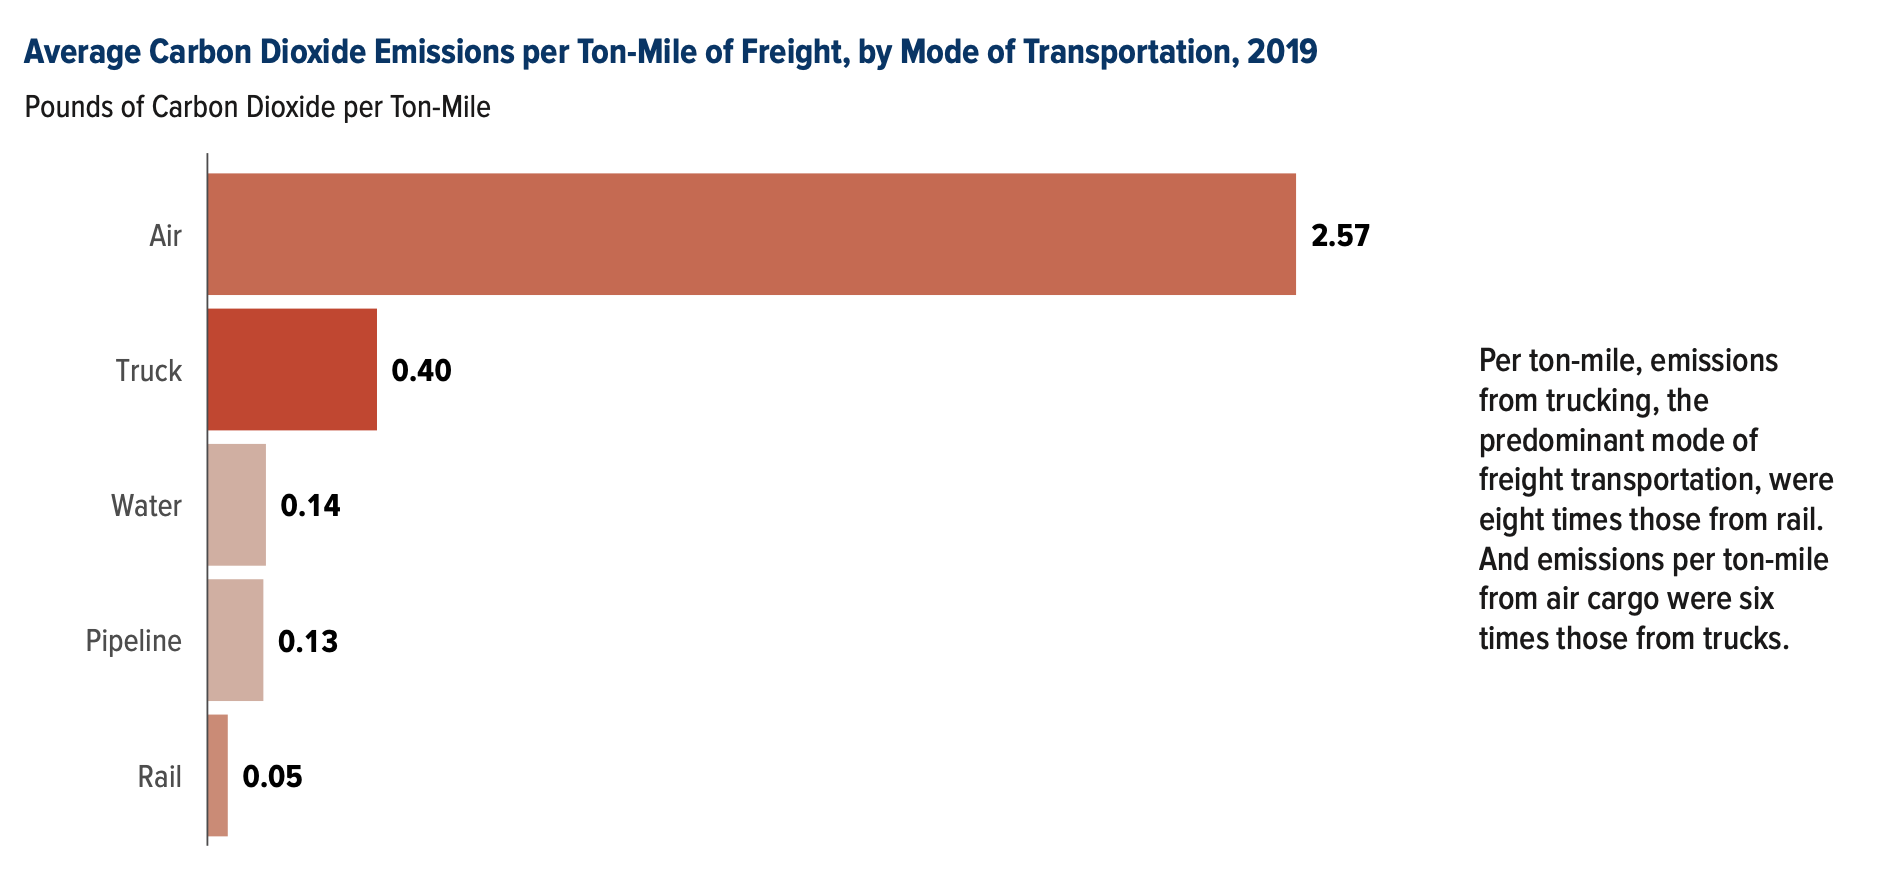
Key takeaway: not only is CBO saying that shipping freight by rail releases eight times less GHG into the atmosphere than shipping the same amount of freight via truck, but rail is also three times better on emissions than moving by water. (It would be good to be able to see the water sector broken down into towed barges versus actual ships, as inland waterway traffic seems that it would be more efficient than that.)
There is much more in the CBO report, so everyone interested in this topic should, at least, bookmark it.

