BLS Releases Gruesome April Jobs Report; Some Transportation Sectors Largely Spared
At 8:30 a.m. this morning, the Bureau of Labor Statistics announced the U.S. employment totals for April 2020. As expected, the news was grim. 20.5 million Americans lost their jobs in April, bringing the two-month March-April decline to 21.4 million, or 14 percent of the February 2020 total workforce. (Total non-farm payroll dropped from 152.4 million jobs in February to 131.1 million jobs in April.)
Transportation. Job losses in the transportation sector are mode-dependent. Jobs in the “transit and ground passenger transportation” category are down 37 percent from February (190,000 jobs) – but that category (defined in NAICS 485) is usually about 40 percent school bus drivers, 40 percent taxi and chauffeur drivers, and 20 percent everything else. Air transportation jobs are, predictably, also down, by 139 thousand jobs (27 percent) from February. (“Scenic and sightseeing transportation” has it the worst – over 60 percent of the workers laid off in two months.)
On the other hand, freight rail and Amtrak, collectively, are only down 1.7 percent from February, and the “courier and messenger” subsector actually had a small increase. Overall, the Transportation and Warehousing sector jobs are down 10.4 percent (591 thousand) since February.
| BLS Seasonally Adjusted Jobs Report, April 2020 (Thousands of Jobs) | |||||||||
| April 2020 versus… | |||||||||
| Feb. 2020 | Mar. 2020 | Apr. 2020 | February 2020 | March 2020 | |||||
| Transportation and Warehousing Sector | |||||||||
| Air transportation | 511.2 | 512.7 | 372.0 | -139.2 | -27.2% | -140.7 | -27.4% | ||
| Rail transportation | 159.9 | 159.6 | 157.2 | -2.7 | -1.7% | -2.4 | -1.5% | ||
| Water transportation | 64.9 | 64.3 | 58.5 | -6.4 | -9.9% | -5.8 | -9.0% | ||
| Truck transportation | 1,527.3 | 1,523.9 | 1,435.6 | -91.7 | -6.0% | -88.3 | -5.8% | ||
| Transit and ground passenger transportation | 508.2 | 503.3 | 318.0 | -190.2 | -37.4% | -185.3 | -36.8% | ||
| Pipeline transportation | 50.5 | 51.4 | 50.5 | 0.0 | 0.0% | -0.9 | -1.8% | ||
| Scenic and sightseeing transportation | 36.7 | 35.4 | 13.9 | -22.8 | -62.1% | -21.5 | -60.7% | ||
| Support activities for transportation | 763.8 | 756.5 | 689.6 | -74.2 | -9.7% | -66.9 | -8.8% | ||
| Couriers and messengers | 847.8 | 846.7 | 848.5 | 0.7 | 0.1% | 1.8 | 0.2% | ||
| Warehousing and storage | 1,207.8 | 1,217.1 | 1,143.0 | -64.8 | -5.4% | -74.1 | -6.1% | ||
| Total, Transportation/Warehousing Sector | 5,678.1 | 5,670.9 | 5,086.8 | -591.3 | -10.4% | -584.1 | -10.3% | ||
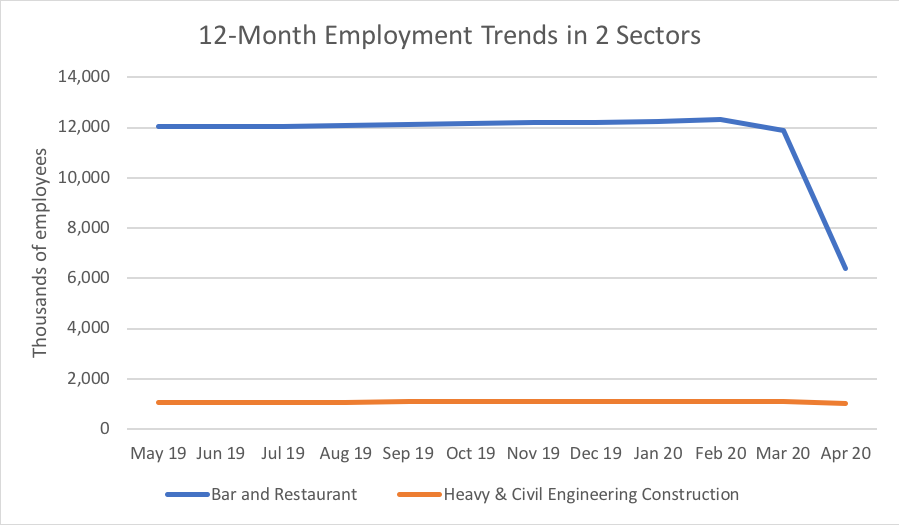
Construction. Jobs in the construction sector are down 13.2 percent from February, a loss of 1.01 million jobs in just two months. However, the job losses are concentrated in the construction of buildings and in specialty trade contractors. In the “heavy and civil engineering construction” subsector, where highway, bridge, tunnel and rail construction jobs are located, only 83 thousand jobs have been lost since February, a decline of 7.6 percent in two months. (Not great, but considering where a lot of other sectors are, not that bad.
| BLS Seasonally Adjusted Jobs Report, April 2020 (Thousands of Jobs) | |||||||||
| April 2020 versus… | |||||||||
| Feb. 2020 | Mar. 2020 | Apr. 2020 | February 2020 | March 2020 | |||||
| Construction Sector | |||||||||
| Construction of buildings – residential | 841.3 | 839.7 | 722.1 | -119.2 | -14.2% | -117.6 | -14.0% | ||
| Specialty trade contractors – residential | 2,124.7 | 2,112.4 | 1,815.0 | -309.7 | -14.6% | -297.4 | -14.1% | ||
| Construction of buildings – nonresidential | 847.8 | 841.5 | 753.0 | -94.8 | -11.2% | -88.5 | -10.5% | ||
| Specialty trade contractors – nonresidential | 2,726.0 | 2,717.8 | 2,324.7 | -401.3 | -14.7% | -393.1 | -14.5% | ||
| Heavy and civil engineering construction | 1,098.9 | 1,094.8 | 1,015.9 | -83.0 | -7.6% | -78.9 | -7.2% | ||
| Total, Construction Sector | 7,638.7 | 7,606.2 | 6,630.7 | -1,008.0 | -13.2% | -975.5 | -12.8% | ||
To put the heavy construction numbers in perspective:
Other sectors. We went through the full Table B-1 attached to the news release to find other sectors and subsectors of the job market who have it worse than transportation, and also found the five sectors and subsectors/industries that have actually seen job growth.
| BLS Seasonally Adjusted Jobs Report, April 2020 (Thousands of Jobs) | |||||||||
| April 2020 versus… | |||||||||
| Feb. 2020 | Mar. 2020 | Apr. 2020 | February 2020 | March 2020 | |||||
| Other sectors/industries who have it bad: | |||||||||
| Furniture and home furnishing stores | 470.7 | 462.0 | 253.0 | -217.7 | -46.3% | -209.0 | -45.2% | ||
| Clothing and accessories stores | 1,289.1 | 1,269.6 | 530.0 | -759.1 | -58.9% | -739.6 | -58.3% | ||
| Sporting goods, hobby, book and music stores | 549.8 | 535.9 | 351.0 | -198.8 | -36.2% | -184.9 | -34.5% | ||
| Child day care services | 1,038.6 | 1,019.5 | 683.3 | -355.3 | -34.2% | -336.2 | -33.0% | ||
| Temporary help services | 2,939.8 | 2,881.9 | 2,040.0 | -899.8 | -30.6% | -841.9 | -29.2% | ||
| Performing arts and spectator sports | 511.7 | 496.4 | 279.4 | -232.3 | -45.4% | -217.0 | -43.7% | ||
| Amusements, gambling, and recreation | 1,785.50 | 1,777.50 | 715.5 | -1,070.0 | -59.9% | -1,062.0 | -59.7% | ||
| Accommodation | 2,091.00 | 2,045.00 | 1,206.00 | -885.0 | -42.3% | -839.0 | -41.0% | ||
| Food services and drinking places | 12,303.10 | 11,875.60 | 6,384.30 | -5,918.8 | -48.1% | -5,491.3 | -46.2% | ||
| Only sectors/industries showing growth: | |||||||||
| Retail – general merchandise stores | 1,968.3 | 1,973.7 | 2,067.1 | +98.8 | +5.0% | +93.4 | +4.7% | ||
| Other information services (Google, etc) | 354.4 | 357.4 | 357.9 | +3.5 | +1.0% | +0.5 | +0.1% | ||
| Federal government | 2,867.0 | 2,886.0 | 2,887.0 | +20.0 | +0.7% | +1.0 | +0.0% | ||
| Manufacture of computers/peripherals | 169.3 | 169.7 | 170.5 | +1.2 | +0.7% | +0.8 | +0.5% | ||
| Couriers and messengers | 847.8 | 846.7 | 848.5 | +0.7 | +0.1% | +1.8 | +0.2% | ||
Gender disparities. Just as I was finishing this article and putting it live on the website, I noticed a new article in POLITICO about how our neighbors to the north are dealing with the COVID-related recession. Prime Minister Justin Trudeau’s advisers are reportedly steering him away from the traditional infrastructure-as-stimulus model in the next economic recovery package because, they say, the mix of job losses in the last two months skews heavily female, and women are extremely underrepresented in the construction trades who would get the immediate employment benefits from infrastructure stimulus:
Trudeau has been told that cutting big stimulus checks to drive infrastructure projects — historically, the centerpiece of government answers to economic crises — won’t be enough. Instead, he’s been advised a key ingredient of the country’s recovery must be child care.

