Amtrak Year-End Reporting Shows Ongoing Ridership, Expense Problems
A review of Amtrak’s final monthly operating report for fiscal year 2022 shows that ridership and revenue on key routes continues to lag behind pre-COVID levels, but that some have moved back faster than others.
The national passenger railroad ran an $885 million operating deficit in fiscal 2022, covered by federal operating subsidies. The federal taxpayers also provided a further $2.0 billion for Amtrak capital costs.
| Amtrak FY 2022 Financial Totals (Million $$) | ||||
| Northeast | National | |||
| Corridor | Network | TOTAL | ||
| Operations | ||||
| Operating Revenues | 1,426.2 | 1,408.3 | 2,834.5 | |
| Federal Operating Subsidies | 79.7 | 805.2 | 884.9 | |
| Operating Expenses | -1,505.8 | -2,213.6 | -3,719.4 | |
| RESULT OF OPERATIONS | 0.0 | 0.0 | 0.0 | |
| Capital | ||||
| Amtrak’s Capital Sources | 440.7 | 262.4 | 703.0 | |
| Federal Capital Subsidies | 1,040.5 | 944.0 | 1,984.5 | |
| Capital Expenses | -1,273.1 | -983.7 | -2,256.8 | |
| Legacy Debt/RRIF Repayment | -131.2 | -7.4 | -138.7 | |
| Carryover Capital Balance | 76.9 | 215.2 | 292.0 | |
To look at trends, we need to compare 2022 to the last full pre-COVID year, fiscal 2019. Ridership has still not completely rebounded, but it is a lot closer on some kinds of routes than others. Long-distance travel, oddly, has rebounded more than have the shorter state-supported routes. And on the Northeast Corridor, the expensive Acela train ridership is still down 40 percent from its pre-COVID level, while the cheaper, less fancy Metroliners are only down 21 percent.
| Amtrak Ridership | |||
| FY 2019 | FY 2022 | Decrease | |
| Acela Riders | 3.58 million | 2.14 million | -1.43 million (-40%) |
| Other NEC Riders | 8.94 million | 7.09 million | -1.85 million (-21%) |
| State-Supported Routes | 15.27 million | 10.20 million | -5.06 million (-33%) |
| Long-Distance Routes | 4.42 million | 3.50 million | -924 thousand (-21%) |
While ridership is down, expenses are up. The most commonly used metric in travel is the expense or revenue per passenger-mile, and those costs are up substantially from the pre-COVID days.
| Amtrak Operating Expenses per Passenger-Mile | |||
| FY 2019 | FY 2022 | Decrease | |
| Acela | 48¢ per pax-mile | 82¢ per pax-mile | +71% |
| Other NEC | 34¢ per pax-mile | 43¢ per pax-mile | +26% |
| State-Supported Routes | 44¢ per pax-mile | 68¢ per pax-mile | +55% |
| Long-Distance Routes | 42¢ per pax-mile | 59¢ per pax-mile | +40% |
However, Amtrak supporters are quick to point out that expenses per passenger-mile are not the most apt metric for train travel, since it is difficult to impossible to downsize the size of a train (the “consist” or number of locomotives and types of cars per train) when ridership drops. Train-miles is another metric that can be used. (Unfortunately the Amtrak reporting rounds these to the hundred thousand train-miles in the monthly reports so they are useless for detail work). By the train-mile metric, the increases in operating costs outside the Northeast Corridor aren’t so bad.
| Amtrak Operating Expenses per Train-Mile | |||
| FY 2019 | FY 2022 | Decrease | |
| Acela | $93 per train-mile | $152 per train-mile | +63% |
| Other NEC | $86 per train-mile | $124 per train-mile | +44% |
| State-Supported Routes | $58 per train-mile | $69 per train-mile | +19% |
| Long-Distance Routes | $71 per train-mile | $87 per train-mile | +23% |
So the operating expenses of running the trains still went up, and revenues have gone down at the same time (but on some trains more than others):
| Amtrak Operating Revenues per Train-Mile | |||
| FY 2019 | FY 2022 | Decrease | |
| Acela | $189 per train-mile | $150 per train-mile | -21% |
| Other NEC | $129 per train-mile | $126 per train-mile | -2% |
| State-Supported Routes | $58 per train-mile | $55 per train-mile | -5% |
| Long-Distance Routes | $37 per train-mile | $42 per train-mile | -14% |
When you add the operating costs and revenues together, you get profit and loss. Here they are, pre- and post-COVID, expressed in terms of passenger-miles and train-miles.
| Amtrak Adjusted Operating Profit/Loss per Passenger-Mile | ||
| FY 2019 | FY 2022 | |
| Acela | +49¢ per pax-mile | -1¢ per pax-mile |
| Other NEC | +17¢ per pax-mile | +1¢ per pax-mile |
| State-Supported Routes | -3¢ per pax-mile | -9¢ per pax-mile |
| Long-Distance Routes | -20¢ per pax-mile | -30¢ per pax-mile |
| Amtrak Adjusted Operating Profit/Loss per Train-Mile | ||
| Acela | +$95 per train-mi | -$1.65 per train-mi. |
| Other NEC | -$43 per train-mi | +2.11 per train-mi |
| State-Supported Routes | -$4 per train-mi | -$14 per train-mi |
| Long-Distance Routes | -$33 per train-mi | -$45 per train-mi |
When put that way, for the Acelas to go from making $95 per mile in profit in 2019 to losing somewhere around $1.65 per mile in 2022 (take the latter figure as approximate, since the monthly reporting rounds the deficit to $3.8 million and the train-miles to 2.3 million, which means it could be anywhere from $1.60 to $1.71) is really astonishing.
The 2022 reporting includes ticket-only revenue per route, which the 2019 data did not include. But for the Acelas, the ticket revenue is almost identical to the total revenue. Dividing ticket revenue by PMs gives the fares in terms of cents per mile. In FY22, tickets sold averaged a fare of 79 cents per mile. But back in 2019, revenues were 98 cents per mile.
So tickets are 20 percent cheaper on the Acela now than they were before COVID, presumably because Amtrak has to discount the fares that much to get people into the seats. But on the other Northeast Corridor routes, average revenue per passenger mile has only dropped from 51 cents per mile to 47 cents per mile, a decline of 8 percent.
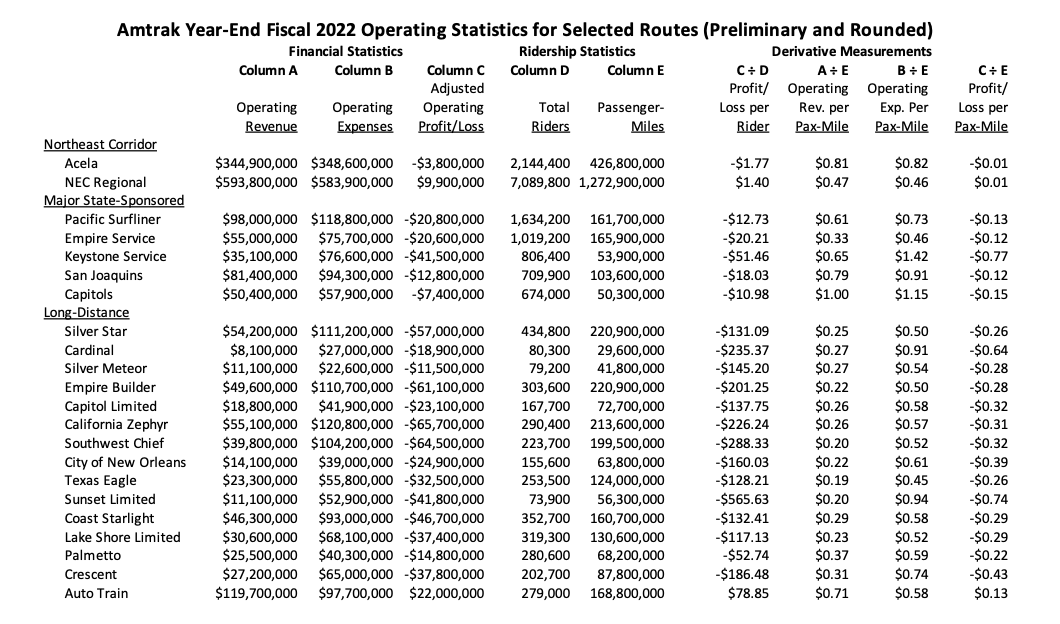
The nation’s most money-losing train, the Sunset Limited, posted an operating loss of $566 per passenger in fiscal 2022. The revenues were 20 cents per passenger-mile, but the operating costs were 94 cents per passenger-mile, for a net loss of 74 cents per passenger-mile.
In terms of which train was the second-worst, if you look per rider, it was the Southwest Chief, losing $288 per passenger. But if you look per passenger-mile, its the Cardinal, losing 64 cents per mile. (The average distance traveled by a Cardinal rider is less than half that traveled on the Southwest Chief).
Lest one think there is no positive news in the long-distance routes, the DC to Florida Auto Train made around $22 million in profit this year, or 13 cents per passenger-mile ($79 per passenger). But this is made possible by charging extremely high fares in exchange for carrying your family car on the train with you. The average Auto Train fare in FY 2022 was $425. The average fare on the next-highest-priced long-distance train, the California Zephyr, was $180.
Put another way, the Auto Train charges passengers, on average, 71 cents per mile and only costs 58 cents per mile to run. In order to make the Sunset Limited break even, at its current costs of 94 cents per mile, it would have to increase its revenues almost fivefold, from the current 20 cents per passenger-mile to 94 cents per passenger-mile. At that rate, a ticket going the whole distance of that line, from New Orleans to Los Angeles, would cost. on average, $1875 (1,995 miles x 0.94).
Amtrak’s vital statistics from fiscal year 2022 are below.