Amtrak Route Expansion Largely Depends on State Willingness to Subsidize
Seeking to capitalize on President Biden’s huge proposed spending increases as part of his American Jobs Plan, Amtrak last month released an ambitious map of proposed service expansions and upgrades that could be realized with some of that money.
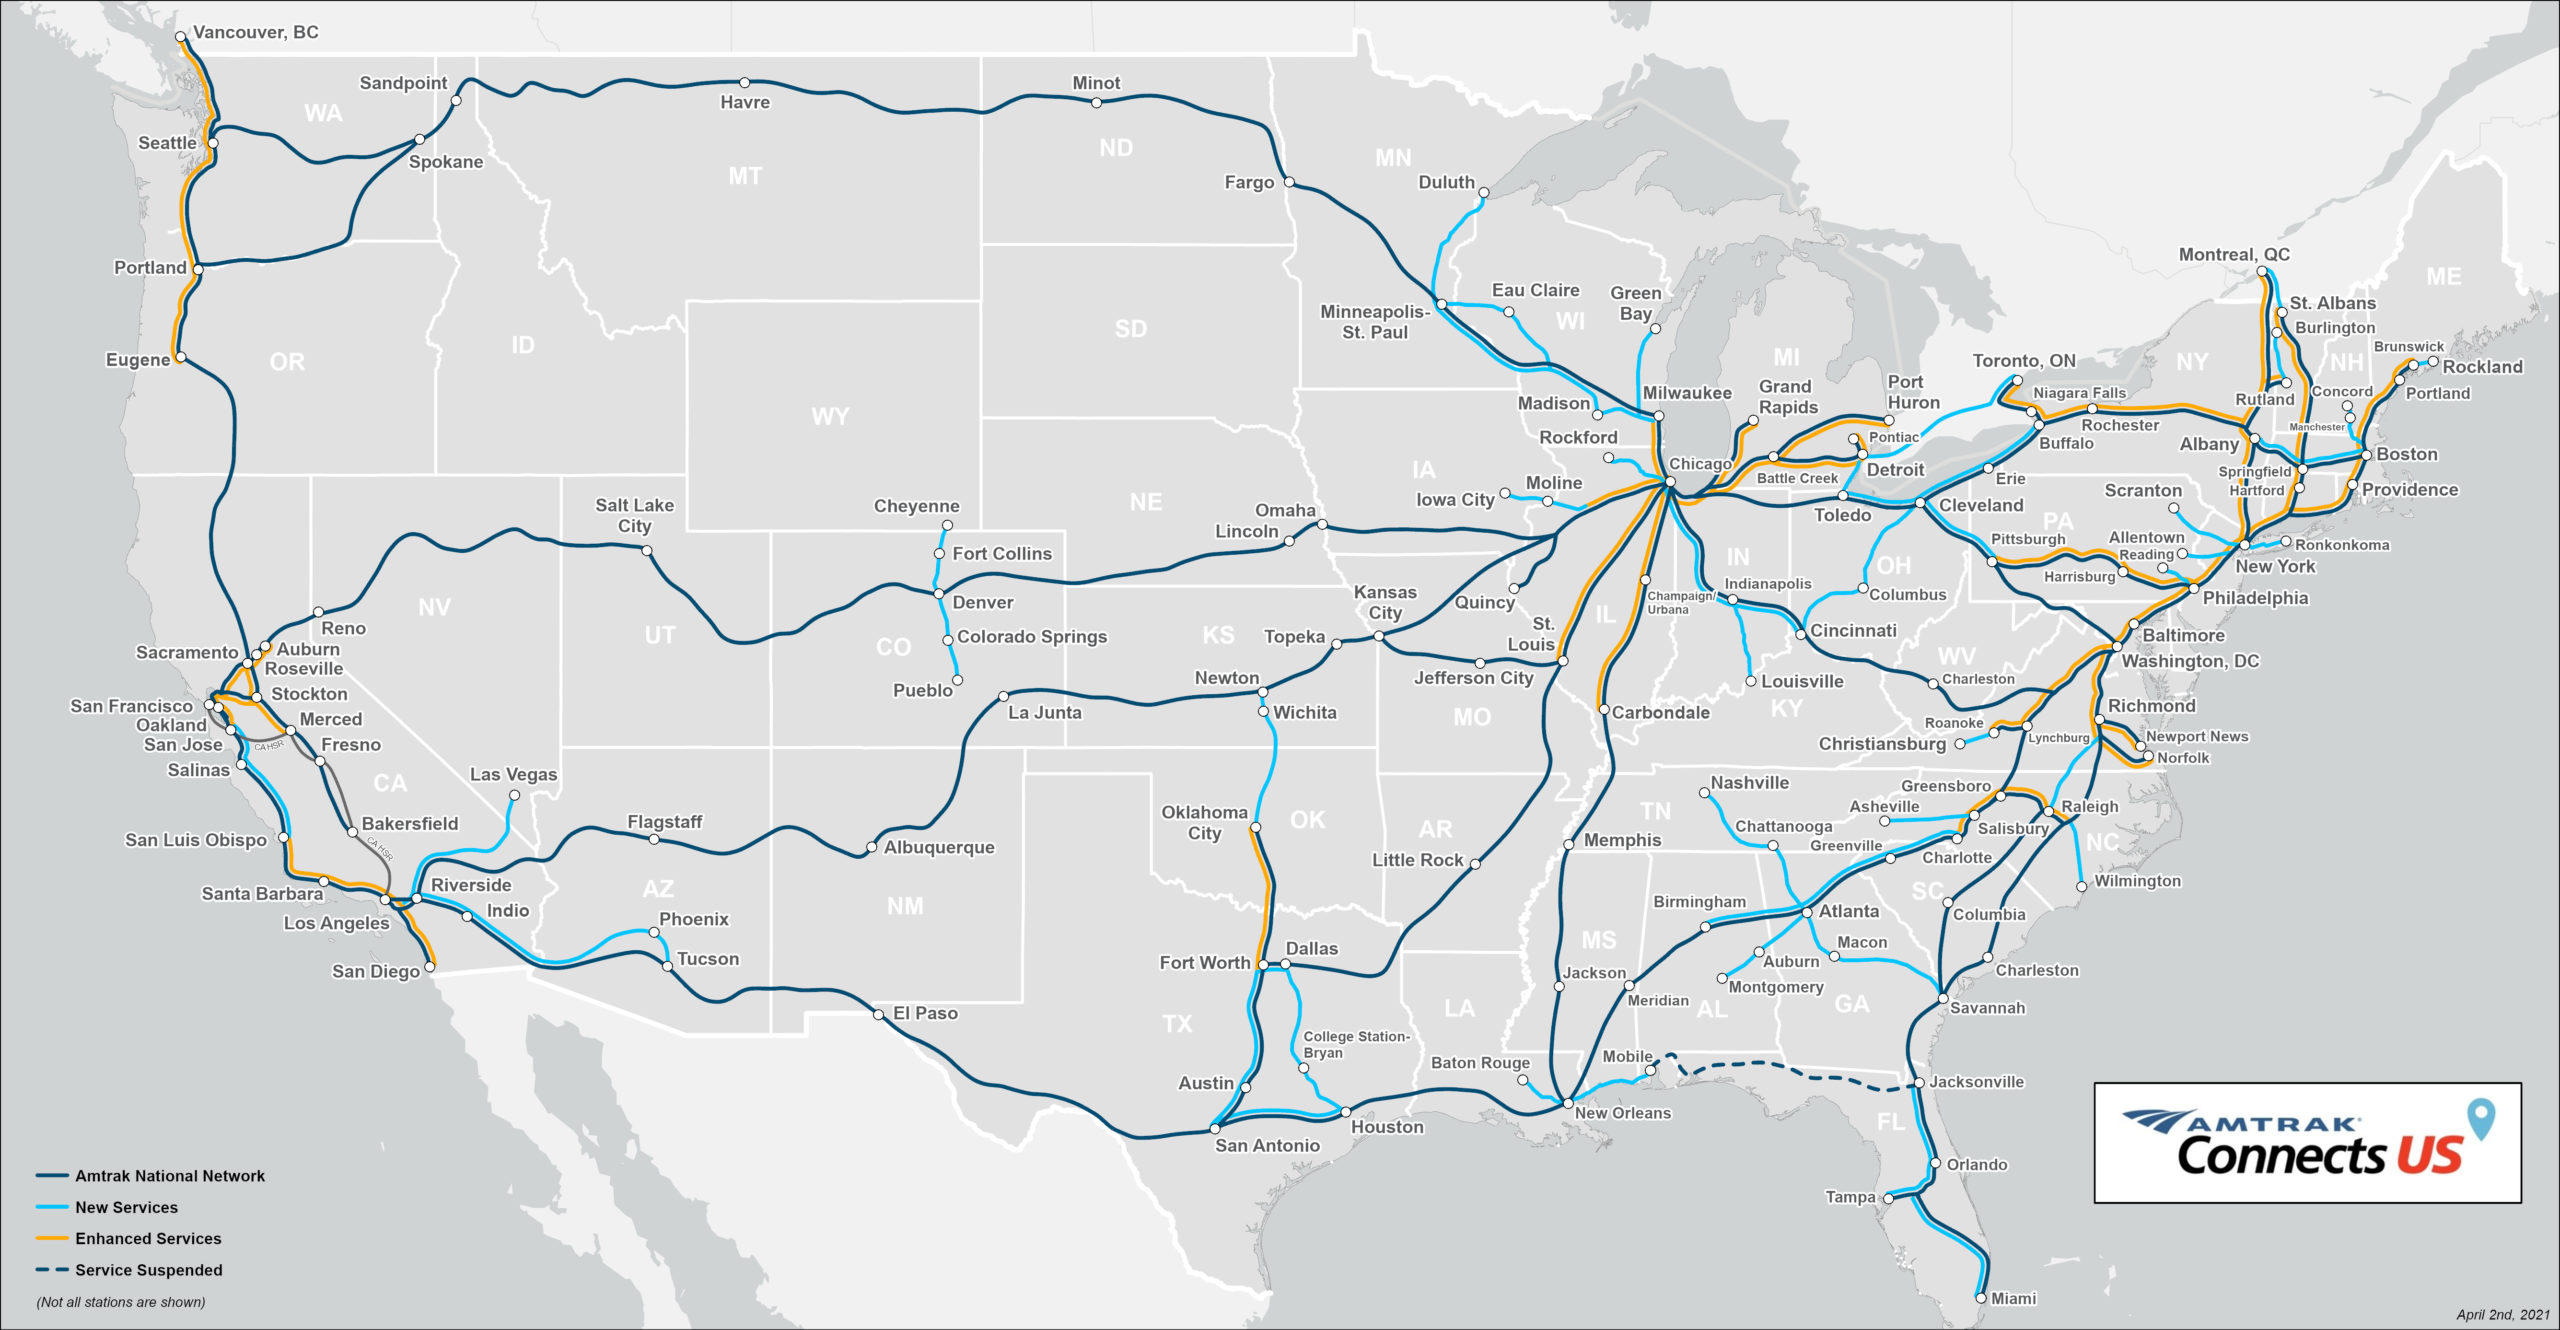
But at last week’s cattle call hearing before the House Railroads Subcommittee, Amtrak President and CEO William Flynn made it clear that much of the proposed new service (most of the light blue lines on the above map) is contingent upon state governments being willing to shoulder much of the operating costs of the train service. Flynn told the committee that the costs of such expansion would be largely borne by states as part of the state-supported route network (he added that Amtrak has already had positive meetings with Colorado and Oklahoma in this regard).
State-supported routes.
Amtrak’s train operations are broken up into three business lines: the Northeast Corridor (NEC) trains from Washington DC to Boston, which make a hefty operational profit; the long-distance routes of over 750 miles, which lose a lot of money per passenger, and the “state-supported routes” in the middle, which vary.
| Amtrak Operations in Fiscal Year 2019 | ||
| Northeast Corridor | 2.1 million passenger-miles | Op. Profit: $569 million (+27¢/pax-mile) |
| State-Supported Routes | 2.0 million passenger-miles | Op. Loss: $58 million (-3¢/pax-mile) |
| Long-Distance Routes | 2.4 million passenger-miles | Op Loss: $475 million (-20¢/pax-mile) |
| Total System | 6.5 million passenger-miles | Op. Profit: $36 million (+3¢/pax-mile) |
When the original Rail Passenger Service Act of 1970 was enacted, creating Amtrak, there was no official distinction between NEC trains and other trains. Amtrak’s initial routes on opening day of May 1, 1971 were all spelled out in the Basic System of routes that had been laid down by Transportation Secretary Volpe in January 1971, because section 401(b) of the Act required Amtrak to provide “intercity rail passenger service between points within the basic system.” And section 403(a) of the Act also allowed Amtrak to start its own service outside the Basic System “if consistent with prudent management.”
But section 403(b)-(c) of the original act required Amtrak to provide service if a state, regional, or local agency demanded it and was willing to pay “no less than 66 2/3 per centum of, nor more than, the solely related costs and associated capital costs, including interest on passenger equipment, less revenues attributable to such service.” Which is how the state-supported routes got started.
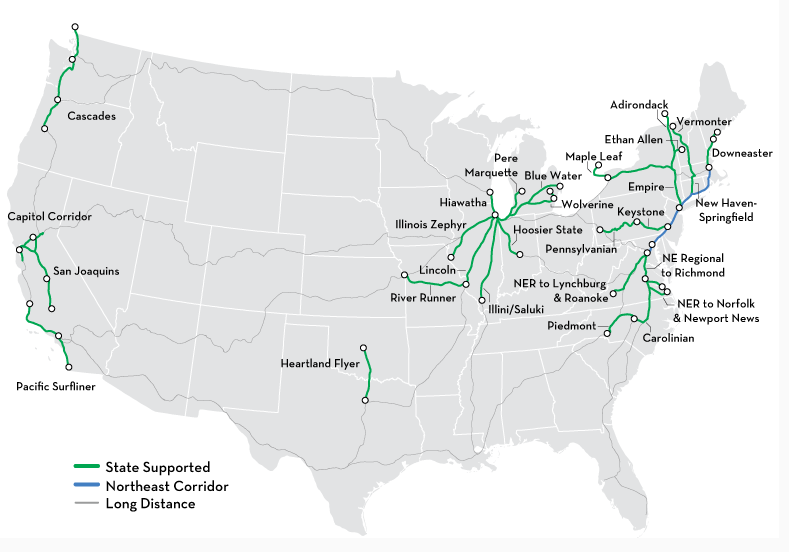
Section 403 has changed over the years – §403(a) is now 49 U.S.C. 24702 and the two-thirds formula in §403(b) and (c) has been replaced by a requirement in 49 U.S.C. 24712 to have a multi-agency State Supported Route Committee decide the cost allocation for each route. The latest map of state-supported routes is below.
In fiscal year 2019 (the last good, normal, pre-COVID year), the state-supported routes posted collective operating losses of around $300 million (15 cents per passenger-mile), but the subsidies paid by the state governments reduced those operating losses to just $58 million (3 cents per pax-mile). But those state subsidy levels can vary widely. The following financial data was taken from Table 10 in Amtrak’s 2021 grant request, which shows actual FY 2019 performance, together with ridership and train-mile data provided directly to us by Amtrak.*
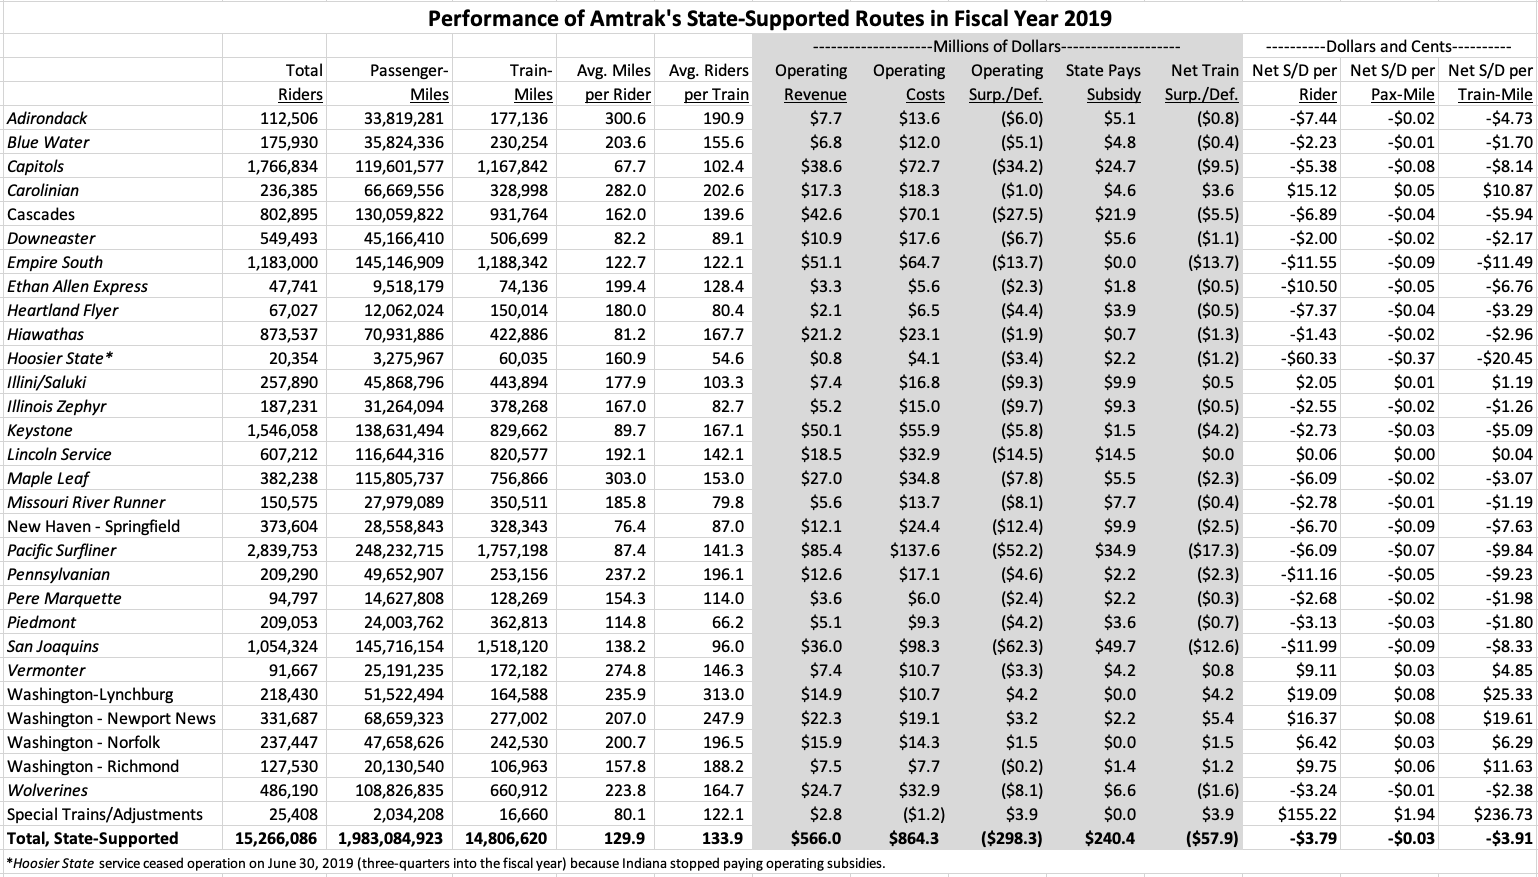
Looking at that table, the first thing that jumps out is that New York State pays zero subsidy for the Empire Service from New York city to Buffalo and thence to Niagara Falls. (They may have been grandfathered – NYC to Buffalo was the only intrastate endpoint route that Secretary Volpe mandated Amtrak serve as part of the Basic System in early 1971, so at least until the 1997 reauthorization act changes (and possibly to the 2008 PRIIA changes), legally, NYC to Buffalo couldn’t be considered a state-supported route under the section 403 process.)
The next thing that jumps out is that California does a huge business with Amtrak in the state-supported route department. For their three state-supported routes (the Capitol Corridor, the Pacific Surfliner, and the San Joaquins, the Golden State paid Amtrak about $109 million in fiscal 2019, reducing the operating loss per passenger from $26 to $7 (meaning, the state paid the equivalent of $19 per passenger, or 21 cents per passenger-mile, in operating subsidies).
Rearranging the data by size of per-passenger subsidy paid by state and federal taxpayers makes it clear why Indiana killed the Hoosier State in summer 2019.
| State Subsidy Per | Federal Subsidy Per | |||
| Rider | Pax-Mile | Rider | Pax-Mile | |
| Hoosier State | $ 106.19 | $ 0.66 | $ 60.33 | $ 0.37 |
| Heartland Flyer | $ 58.28 | $ 0.32 | $ 7.37 | $ 0.04 |
| Missouri River Runner | $ 50.99 | $ 0.27 | $ 2.78 | $ 0.01 |
| Illinois Zephyr | $ 49.49 | $ 0.30 | $ 2.55 | $ 0.02 |
| San Joaquins | $ 47.11 | $ 0.34 | $ 11.99 | $ 0.09 |
| Adirondack | $ 45.52 | $ 0.15 | $ 7.44 | $ 0.02 |
| Vermonter | $ 45.31 | $ 0.16 | $ – | $ – |
| Ethan Allen Express | $ 38.34 | $ 0.19 | $ 10.50 | $ 0.05 |
| Illini/Saluki | $ 38.21 | $ 0.21 | $ – | $ – |
| Cascades | $ 27.32 | $ 0.17 | $ 6.89 | $ 0.04 |
| Blue Water | $ 27.02 | $ 0.13 | $ 2.23 | $ 0.01 |
| New Haven – Springfield | $ 26.41 | $ 0.35 | $ 6.70 | $ 0.09 |
| Lincoln Service | $ 23.89 | $ 0.12 | $ – | $ – |
| Pere Marquette | $ 23.00 | $ 0.15 | $ 2.68 | $ 0.02 |
| Carolinian | $ 19.47 | $ 0.07 | $ – | $ – |
| Piedmont | $ 17.05 | $ 0.15 | $ 3.13 | $ 0.03 |
| Maple Leaf | $ 14.45 | $ 0.05 | $ 6.09 | $ 0.02 |
| Capitols | $ 13.95 | $ 0.21 | $ 5.38 | $ 0.08 |
| Wolverines | $ 13.52 | $ 0.06 | $ 3.24 | $ 0.01 |
| Pacific Surfliner | $ 12.28 | $ 0.14 | $ 6.09 | $ 0.07 |
| Washington – Richmond | $ 11.18 | $ 0.07 | $ – | $ – |
| Pennsylvanian | $ 10.60 | $ 0.04 | $ 11.16 | $ 0.05 |
| Downeaster | $ 10.21 | $ 0.12 | $ 2.00 | $ 0.02 |
| Washington – Newport News | $ 6.64 | $ 0.03 | $ – | $ – |
| Keystone | $ 1.00 | $ 0.01 | $ 2.73 | $ 0.03 |
| Hiawathas | $ 0.75 | $ 0.01 | $ 1.43 | $ 0.02 |
| Empire South | $ – | $ – | $ 11.55 | $ 0.09 |
| Washington-Lynchburg | $ – | $ – | $ – | $ – |
| Washington – Norfolk | $ – | $ – | $ – | $ – |
If state governments see the connectivity that Amtrak service could provide from Denver to Pueblo, or from Minneapolis to Duluth, or from Chicago to Rockford as being worth the tax dollars to pay the per-passenger costs necessary to provide the service, then many of the service expansion possibilities on the Amtrak Connects US map could be realized.
*Table 9 in that document says that total state subsidy payments in FY19 were $234.2 million. Table 10 only gave us state payments as percentages of each train’s revenue, not the state dollar amounts, and those add up to $240.4 million, as shown in the table above. So treat every state-supported dollar amount in the table as subject to a rounding error of 2 or 3 percent.

