2018 ACS Survey: While Most Americans’ Commuting Trends are Unchanged, Teleworking Continues to Grow, and Driving Alone Dips in Some Major Cities
The greatest daily demands on our transportation system come when most Americans travel to work. Understanding and serving those needs is one of the key challenges facing transportation planners, policymakers, and engineers. Data from the newly released 2018 American Community Survey shows that telework continued its upward trend, while driving alone to work trended slightly downward. Several regions that had a reduction in the share of workers driving alone had a corresponding increase in biking and walking to work.
On September 26, the U.S. Census Bureau released the one-year estimates from the 2018 American Community Survey (ACS), conducted from January 1, 2018 to December 31, 2018. The one-year ACS estimates are available for areas with populations of 65,000 people or more, while the five-year estimates, set for release in December, cover all census geographies regardless of population.
The ACS one-year estimates draw upon a smaller sample of respondents than the five-year estimates and can have larger margins of error for smaller geographies and population subgroups.[1] Analyzing one-year estimates can sometimes require a trade-off between accuracy and currency. For rapidly-changing areas like cities, the one-year estimates can provide a glimpse into changes in population, housing, transportation, and economic characteristics, though some patterns should be interpreted with caution as potential trends to monitor over time (and corroborate or refute with future data).
Among the breadth of information measured in the ACS estimates are useful measures of how Americans get to work, how many vehicles they have available, what time they leave for work, and how long their commutes typically take. This overview will primarily take a look at workers’ means of transportation to work, and how mode share among commuters has (or has not) shifted nationally and among the 15 largest cities in the U.S.
Tables 2 and 3 present data for the Urbanized Area of each metro as well as the official city limits to compare mode shares between a city’s urban core and broader region. Urbanized Areas represent densely developed areas (at least 50,000 people) and provide a finer geographic scale than metropolitan-statistical areas, which encompass all counties in a given metro area.
1. Nationwide mode share to work remains mostly unchanged, but working from home surpasses public transit for the second year in a row.
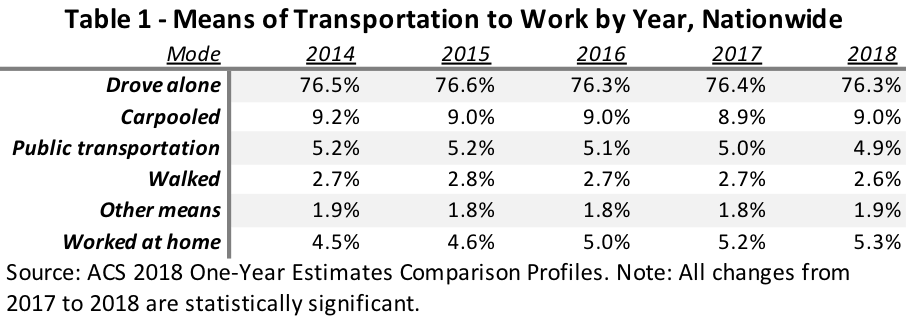
At the national level, commuters’ mode share to work has remained broadly consistent over the past five years. The share of Americans taking public transit to work has consistently ticked down from 5.2% in 2014 to 4.9% in 2018 while the share of Americans working from home has steadily increased from 4.5% in 2014 to 5.3% in 2018. In the 2017 ACS one-year estimates, the share of Americans working from home surpassed the share of workers taking public transit for the first time, a trend that has held up in 2018. Mode shares for driving alone, carpooling, and walking have fluctuated slightly from 2014 to 2018, though all except carpooling have ticked down slightly since 2017, and all three have declined from their 2014 levels.
2. Driving alone down slightly in most cities, transit mode share mostly stable.
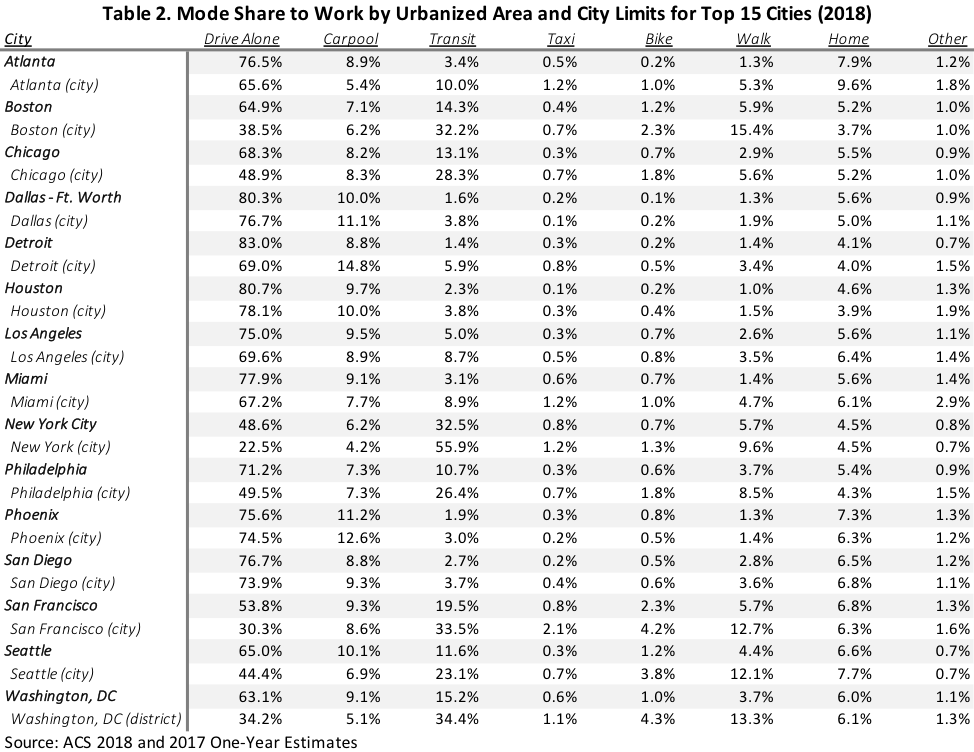

Of the 15 regions profiled, the share of workers driving alone decreased in the past year in 10 of the regions and 9 of the core cities. The most substantial drops were in Seattle (-2.8% in the city, -1.5% regionally), San Francisco proper (-2.1%), Detroit (-2% in the city, -1.1% in the region), Philadelphia proper (-1.5%), and San Diego proper (-1.5%). The most substantial increase was in Houston (1.2% in the city, 0.6% in the region). In a few cities, the share of commuters driving alone to work moved noticeably in opposite directions in the city proper and broader region. In Atlanta and San Francisco, the share of workers driving alone dropped in the city limits (almost 1 point in Atlanta, two points in San Francisco) but increased in the region as a whole.
The share of commuters taking transit to work fluctuated less than 1 percentage point in most regions between 2017 and 2018, though there were a handful of outliers with more pronounced shifts. The most noticeable drops in transit mode share occurred in the city limits of Boston (-2.8%), Atlanta (-1.2%), Miami (-1.2%), and San Francisco (-1.2%), while the most notable increases occurred in Philadelphia (2.5% in the city proper, 1% in the region) and Washington DC (1.8% in the District, 0.4% regionally).
3. Carpooling and active transportation is up in cities with large drops in workers driving alone
Among the cities with noticeable decreases in the share of workers driving alone, this drop could be associated with increases in either active transportation or carpooling. In Seattle and Philadelphia, the drop in workers driving alone to work also corresponded with declines in the share of workers carpooling and notable increases in transit, biking, and walking. The share of commuters taking transit to work increased by 2.5 points in Philadelphia proper and 1 point in the Philadelphia region, as well as by 0.2% in Seattle proper and 0.6% in the region. Walking and biking also increased 1.8 and 1.0 points respectively in Seattle proper, suggesting that the drop in automobile-based means of transportation could be explained by an increase in active modes.
On the other hand, the large drops in workers driving alone in San Francisco, Detroit, and San Diego corresponded with almost equally large increases in workers carpooling, suggesting that at least some of the decline in single-occupancy trips could be explained by a rise in carpool trips. However, these cities also saw slight upticks in the share of workers biking or walking to work. The notable exception to this trend was Atlanta, where the large drop in workers driving alone, carpooling, and transit (-0.8% drop in driving alone, -1.6% drop in carpooling, -1.2% drop in transit) corresponded with a noticeably large 2.3 point jump in the share of workers working from home, the largest increase of all cities.
Future Analysis
The ACS one-year estimates provide us with a glimpse into how Americans get to work in cities and towns across the country each year. The latest round of estimates indicate that teleworking continues to be on the rise in the United States, surpassing public transit as the third most-used means of going to work. At the metro-level, most cities appear to be seeing slight decreases in the share of workers driving alone to work, with a handful of cities like Seattle, Philadelphia, and Detroit seeing more substantial drops. Among these cities, some like Seattle appear to be experiencing noticeable increases in active transportation like biking, walking, and transit (a trend noted in reporting earlier this year and a local mobility survey in 2018), while others appear to be experiencing a rise in carpooling and telework.
As some cities begin to reevaluate their approaches to mobility, further local surveying of mode choice and analysis of other mobility metrics like transit ridership can offer a more precise look at travel behavior, monitor the progress of cities’ mobility strategies, and either corroborate or refute the initial patterns seen in the ACS data.
[1] Margins of error vary for each estimate and geographic level. More information can be found here. Statistical significance of changes in means of commuting for work can be found for all geographies in the 2018 ACS Comparison Tables using the Census online data retrieval tool.

