2017 Highway Fatalities Down for First Time in Two Years
October 5, 2018
The National Highway Traffic Safety Administration released the annual estimate of fatalities from highway accidents in the United States for calendar year 2017, showing that fatalities decreased slightly after two years of increases. The new numbers from the Fatality Analysis Reporting System (FARS) indicate that 37,133 people died in auto accidents in the U.S. in 2017, down 1.8 percent (673 deaths) from 2016.
In its current FARS format, the fatality data only goes back to 1975, but the summary chart in the new update shows that 37,133 is still down significantly from the 1979 peak of 51,093. But the population has grown substantially since then, and the total number of miles driven has more than doubled. Viewed in terms of fatalities per 100 million vehicle-miles traveled, the 2017 number is 1.16 per 100 million miles, which is down about two-thirds from the original 1975 peak (repeated in 1980) of 3.35 per 100 million miles.
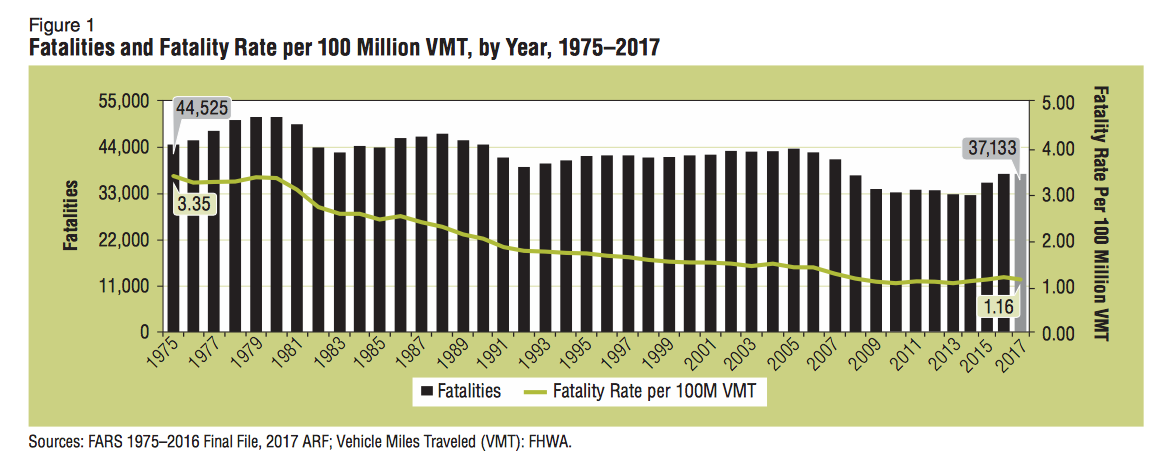
Put another way, in 1975 there was one fatality for every 29.851 million miles driven. In 2017, there was one fatality for every 86,956 million miles driven.
The post-1975 low point was 2014, both in terms of raw numbers (32,744) and per 100 million VMT (1.08).
Pre-FARS, the Federal Highway Administration has a table that has estimates all the way back to 1900, back when driving a car was for daredevils only. They estimate that, in terms of raw numbers, the peak of highway fatalities was 1972 at 55,600 and the peak in terms of deaths per hundred million VMT was back in 1909 at a stunning 45.33 (one death for every 2.2 million VMT).
The FARS data also breaks down the fatalities in several ways – by vehicle occupant/non-occupant, by vehicle type, by seatbelt use, time of day, and by driver age. It terms of vehicle type, the big outlier is that the fatalities of occupants of large trucks (which generally has to mean the drivers, since tag-alongs are rare) are up 16 percent over last year while most other types of fatalities are down 1-2 percent.
| 2016 | 2017 | Change | ||
| Occupants | ||||
| Passenger cars | 13,508 | 13,363 | -145 | |
| Pickup trucks and SUVs | 10,369 | 10,188 | -181 | |
| Large trucks | 725 | 841 | +116 | |
| Motorcycles | 5,337 | 5,172 | -165 | |
| Non-occupants | ||||
| Pedestrians | 6,080 | 5,977 | -103 | |
| Pedalcyclists | 852 | 783 | -69 | |
| Other/unknown | 261 | 228 | -33 | |
| Buses/other uncategorized | 674 | 581 | -93 | |
| TOTAL | 37,806 | 37,133 | -673 | |
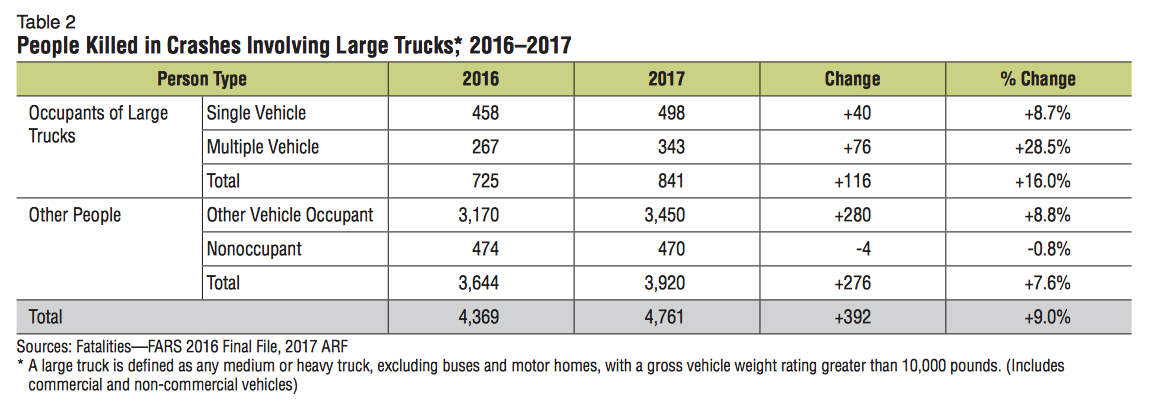
The report notes that the number of large truck fatalities was the largest it has been since 1989 (when there were 858 fatalities) and indicates that of the 116 increased large truck occupant fatalities, 76 were in multi-vehicle accidents (up 28.5 percent from last year) and the other 40 were in single-vehicle accidents.
Because of the multi-vehicle accidents, FARS estimates that the number of fatalities of occupants of the other vehicles involved in accidents with large trucks also increased by 8.8 percent in 2017:
Of the 37,133 total fatalities in 2017, FARS estimates that 10,874 of them, or 29 percent, were alcohol-related.

