2016 VMT Redux – How Does It Affect Safety and Costs?
March 3, 2017
Last week’s ETW contained an article that examined the new estimates of total vehicle-miles traveled in the U.S. (a 3 percent increase over 2015) and then analyzed the new data on a per capita basis and also as a share of gross domestic product. Last week’s ETW also contained an article by another author reporting on the new highway fatality estimates by the National Safety Council (a 6 percent increase over 2015).
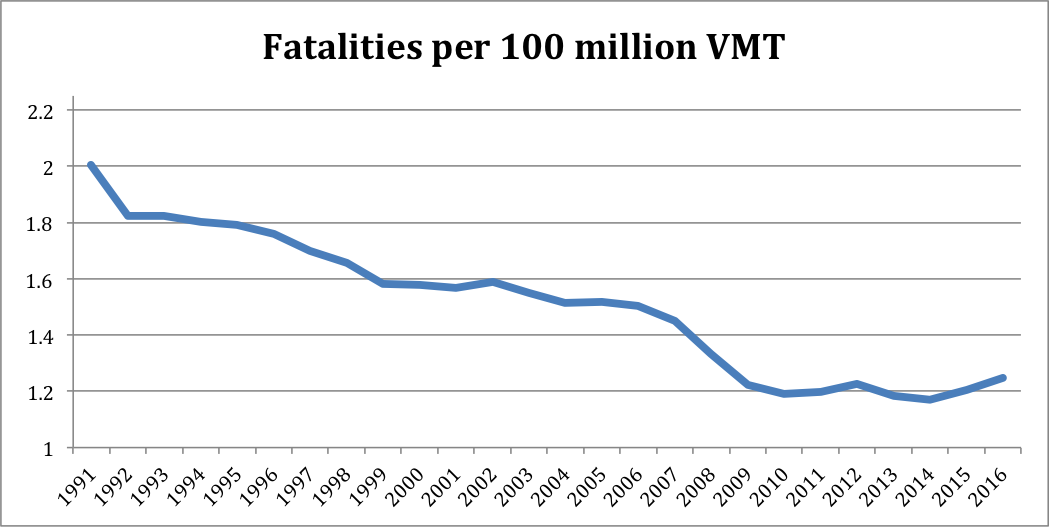
The NSC numbers show that the number of fatalities per VMT has increased again in 2016, as it did in 2015. However, those were a bit of a rebound from a phenomenal reduction over the last 25 years.
The long-term data from the NSC shows that highway fatalities per 100 million vehicle miles-traveled dropped from 2.0 back in 1991 (the first year of the current Traffic Volume Trends data) to an all-time low of 1.17 in 2014 before the current rebound began.
Also, a tweet from the American Highway Users Alliance over the weekend reminded us that estimates of future raw VMT numbers are the basis for the Federal Highway Administration’s projections of the cost of future highway and bridge maintenance. (FHWA’s biennial estimates came out two months ago; see ETW’s coverage here.)
FHWA actually uses two different models for estimating VMT – one is based on state-reported data and forecasts (the “HPMS” system) and the other is based on a nationwide economic model produced by FHWA itself. In the new report, the HMPS forecast calls for annual VMT growth over the 20-year 2012-2032 period averaging 1.41 percent, while the FHWA economic model calls for lower VMT growth (1.04 percent per year).
By comparison, the average VMT growth over the 1992-2002 period (the “good old days”) was 2.71 percent and average growth over the 2002-2012 period was just 0.39 percent. But annual VMT growth in 2014, 2015 and 2016 has been 1.3 percent, 3.5 percent and 2.8 percent, respectively.
Chapter 10 of the latest FHWA report contains a sensitivity analysis of how future costs of road and bridge maintenance would change if future VMT growth is higher than current estimates. FHWA estimates that if 2012-2032 VMT growth rates average 1.04 percent per year (their in-house economic model), then the annual cost to maintain the current road/bridge system, to all levels of government would be $89.9 billion per year and the cost to improve the current system to an ideal benefit-cost analysis level of 1.0 would be $142.5 billion per year (both measured in 2012 dollars).
But if the higher, state-measured estimate of a 1.41 percent annual VMT growth rate proves correct, this increases the cost to maintain the current system by $11.2 billion per year and increases the cost of improving the current system to $17.3 billion per year.
The 2015 and 2016 VMT growth rates of 3.5 percent and 2.8 percent would seem to indicate that the higher growth rates in the state-based HPMS forecast are not out of the question. But no one knows what the future holds. (See Exhibit 9-4 of the FHWA report for an amusing graph showing how none of the previous forecasts saw the Great VMT Flat-Lining of 2007-2014 coming.)
In particular, forecasts of petroleum prices (a significant driver of VMT) over the last decade have been mostly worthless – we have gone from “peak oil” panic to a shale-driven glut. This fundamental uncertainty will continue in future decades.
But more important is the uncertainty surrounding technological change. As the shift towards more autonomous vehicles continues, no one can say with certainty whether this technology will result in more VMT, or less VMT – it depends on the business model that develops. This discussion from Eno’s 2016 Convergence conference is relevant – if autonomous vehicles prompt a shift away from private car ownership towards shared on-demand fleets, AV’s could result in less VMT (though it depends on whether or not the self-driving cars keep constantly driving around in urban centers waiting for a hail, as cabs now do).
But as Jackie Glassman said at that discussion, if people keep owning their own cars, and driving becomes easier and more stress-free, all other things being equal, you get more driving – especially from people like senior citizens and the disabled who don’t travel much now but would travel more if they had a self-driving car.

